Skip to content

What Is Session Replay and How It Improves User Experience in IT Environments

Anyone who works in technology quickly learns this truth: users will always interact with systems in the most unexpected and baffling ways… and when something goes wrong, they swear they “didn’t touch anything.” There’s a vast ocean between how something is designed and how it’s actually used—an ocean filled with bugs waiting to be caught. But there’s a way to bridge that gap: session replay.
Thanks to this event-capturing and playback technique, we can align technology with user experience, boosting both user satisfaction and technical support efficiency. In this article, we’ll explore what session replay is, how it differs from other monitoring tools, and how to apply it to create happy users—and technicians who don’t feel like strangling them.

Improving User Experience Through Monitoring

Technology only fulfills its true purpose when it benefits the user —boosting productivity, enhancing comfort, and simplifying tasks. That positive experience is essential for technology adoption and long-term success. That’s why observing how users interact with technology to prevent issues and optimize performance is no longer optional.
Often, companies try to improve user experience through surveys or feedback forms. But in many cases, the technician is disconnected from the end-user process (because they don’t use the system daily), and the user isn’t equipped to articulate how to improve it—or even what went wrong—due to a lack of technical understanding.
Session replay removes those barriers.

What Is Session Replay and How Does It Differ from Other UX Techniques?

Session replay is a technology that records a user’s interactions on a website or application—capturing events like clicks, scrolling, and form inputs, as well as changes to the DOM (Document Object Model). Using this structured data, it reconstructs the user’s session step-by-step, allowing teams to visually observe behavior and troubleshoot more effectively.
Session replay isn’t the only method available for understanding user behavior. Other options include:

  • Session recording. Captures user sessions as video footage of screen activity, while session replay uses structured event data to recreate the session more precisely and flexibly.
  • Heatmaps. Provide aggregated visual data showing where users click or scroll most often, but don’t offer insights into individual sessions or their chronological flow.
  • Traditional analytics. Offer quantitative metrics such as bounce rates and time on page, but lack the visual context and detailed workflow progression that replay provides.

How Does Session Replay Work Technically?

Session replay works by capturing detailed data about what happens on a page or application through multiple sources:

  • Changes in the DOM (Document Object Model): This includes dynamic updates triggered by technologies like AJAX.
  • User events and inputs: Such as clicks, keystrokes, form submissions, and navigation actions.
  • Visual or screen captures: Using snapshots to detect elements like custom fonts or complex CSS that may not be reflected accurately through DOM changes alone.

These events are typically stored in structured formats (e.g., JSON) and later used to reproduce the session using rendering engines such as WebSocket streams or WEBGL.
This reconstruction enables a precise, step-by-step replay of the user’s experience—often including elements and data that video-based session recordings cannot capture or parse from motion imagery.
However, like everything in life, session replay has its limitations.
For instance, on mobile devices, capturing system-level events depends heavily on the SDK provided. Web technologies like Canvas or WebGL might not be easily recordable, especially if privacy-conscious users block their access. For example, someone using Firefox with Enhanced Tracking Protection enabled—especially if they block Canvas to prevent fingerprinting—may render session replay ineffective for any site relying on Canvas-based rendering. Likewise, popular ad blockers like uBlock Origin can block replay scripts if they’re flagged as potential trackers.
These restrictions can reduce the accuracy and completeness of session replay data in reproducing the user’s actual experience.

Use Cases of Session Replay

Being able to “look over the user’s shoulder” and gather structured, analyzable data is incredibly valuable—not to fulfill a dystopian surveillance fantasy, but to better understand and improve the user experience while speeding up issue resolution.
Here are some of the most common session replay use cases:

  • In UX. To identify and eliminate friction points in web/app usage, improve usability, increase efficiency, and ensure the technology works for the user—not against them.
  • In Product Development. To analyze how the product is actually used (spoiler: it’s never exactly as intended), determine which features are most adopted, and evaluate the impact of newly released features. The goal is to align the product with real user needs.
  • In Business and Marketing. To improve conversion rates by identifying pain points, understanding where users drop out of the sales funnel, and learning why they abandon a process.
  • In Technical Support. To reduce the volume of support tickets and, most importantly, to see what really happened behind the user’s all-time favorite sentence: “I didn’t touch anything.”

Technical Challenges and Limitations of Session Replay

While session replay delivers structured and actionable data far more useful than raw video recordings (which require tedious manual review), this technology comes with several important challenges.
For instance, capturing too many interactions may generate excessive data, much of which may not be meaningful. This overload can lead to slower system performance and storage issues—ironically degrading the user experience it aims to improve.

If most sessions recorded are irrelevant to the goal being analyzed (e.g., test environments, bots, or edge cases), any conclusions drawn—no matter how sophisticated the analysis—may be misleading or irrelevant.

Deploying session replay can resemble a digital “surveillance state” if not implemented carefully. It tracks everything the user does, which means mishandling the data or failing to follow best practices can lead to privacy violations or legal issues.

Common Mistakes and Best Practices with Session Replay

To avoid technical pitfalls or legal issues, the first step is steering clear of the most common mistakes:

  • Recording Everything: More data doesn’t equal more insight. Without filtering based on specific objectives, you’ll bog down system performance and fill storage with irrelevant information.
  • Failing to Anonymize: Privacy is crucial and so are the penalties for neglecting it. Always anonymize sensitive data. Remember: session replay is meant to improve usability, not act as surveillance.
  • Lack of Context: Data alone is meaningless without proper context. For example, if a session appears slow, replaying it without correlating other data (like CPU load or concurrent processes) won’t reveal the root cause.

Once these issues are addressed, here are some best practices to follow:

  • Set Clear Goals: Define exactly what you wish to understand—then collect only the data needed to meet that goal. Efficiency is key.
  • Segment Sessions and Data: Categorize by behavior, such as users who abandoned a shopping cart or used a new feature in your application, to make targeted improvements.
  • Correlate with Quantitative Analytics: Combine session replay insights with traditional analytics (e.g., Google Analytics) for a broader understanding. This layered approach is especially helpful when assessing the impact of UI or UX changes.

Popular Session Replay Tools

If this topic has sparked your interest, there are several session replay solutions available—here’s a comparison of some of the most widely used tools:

Tool

Type

Strengths

Limitations

Best for

Mixpanel

SaaS (Proprietary)

Integration with product analytics

Advanced event filtering

Free tier available

High cost for unlimited sessions

Less technical depth (focuses on product and marketing)

Product and marketing teams focused on funnel optimization and data-driven decisions

Amplitude

SaaS (Proprietary)

Correlates sessions with business metrics

A/B testing support

Free tier available

Complex setup

Expensive with large data volumes

Businesses focused on user conversion and retention

Datadog

SaaS (Proprietary)

Integrates with logs, APM, infrastructure metrics

Full-stack visibility

Risk detection with ML

Less UX-focused

High cost for small teams with many hosts

DevOps teams needing complete observability

PostHog

Open Source / SaaS

Self-hosting available

Full suite (recording + analytics)

Requires technical upkeep in self-hosted setup

Startups or tech teams with tight budgets

OpenReplay

Open Source /SaaS

Free and self-hostable

Built-in sensitive data masking

Fewer native integrations compared to SaaS tools

Organizations with strict privacy or data control requirements

How to Choose and Configure the Right Session Replay Tool

Which tool to choose depends on your organization, its goals… and of course, its budget—because that’s how real life works.
If you need total control and strong anonymization, you might lean toward OpenReplay hosted on your own servers. But if your focus is on the business side, like understanding the customer journey through your product or website, Amplitude and Mixpanel are purpose-built for that.
Key factors to evaluate when choosing a tool:

  • Data capture capabilities and how the tool filters that data.
  • Data retention policies and storage duration
  • Scalability, especially if you plan to expand to more systems or expect growth in users.
  • Integration with your existing infrastructure and whether the tool works well with your other analytics and data sources.

General Best Practices for Secure and Effective Setup:

  • Start small: Only collect critical data initially—you can always expand later.
  • Monitor what’s collected: Check out the insights you’re actually gaining from the captured data.
  • Evaluate impact: Check whether session replay affects system performance or storage capacity.
  • Configure privacy settings carefully: This is essential and deserves special attention to avoid compliance or trust issues.

Session Replay Privacy, Anonymization, and Regulatory Compliance

In this era of increased scrutiny over every tech move, it’s critical to emphasize that session replay is meant to generate insights that enhance user experience and streamline bug resolution through aggregate data—not to spy on individual behavior. However, since it involves tracking events like keypresses or page visits, privacy concerns must be taken seriously.
Keypress data can inadvertently capture sensitive inputs, like passwords, or expose visits to pages containing intimate personal information.
That’s why it’s essential to comply with relevant data privacy regulations, depending on your organization’s location and audience. For example:

  • GDPR (General Data Protection Regulation) in the European Union, which requires collecting only the minimum necessary data, mandates explicit user consent when collecting personal data (e.g., email addresses, IPs) and guarantees the right to be forgotten, meaning users can request erasure of their data.
  • PCI-DSS (Payment Card Industry Data Security Standard):. Prohibits the recording of card numbers, CVV codes, and PINs under any circumstances.

Fortunately, most modern session replay tools are designed with these risks in mind and offer built-in privacy features, such as: real-time field masking (replacing sensitive input with asterisks); selective data exclusion, especially for sensitive HTML input types; options to hash or omit IP addresses entirely. Still, organizations must carefully tailor these privacy configurations to match their specific use cases and compliance requirements.

Session Analysis: Methodology and Patterns

The best tool is useless if we don’t apply best practices. That’s why, regardless of the session replay solution you choose, the basic usage methodology should be:

  • Clearly define your objectives. We don’t implement session replay just because it’s trendy or to show off. The first step is to clearly define the goal. Is it to improve the user experience? Increase online store sales? Enhance employee productivity?
  • Translate goals into key indicators. How do we measure whether the goals are being met? This is where KPIs come in. These might include conversion rates, shopping cart abandonment rates, the number of records entered in a work application, or the average time it takes to complete those records.
  • Verify if session replay provides the necessary data for the KPIs, and integrate with other sources if needed (such as traditional analytics).
  • Identify patterns and anomalies. Session replay delivers a wealth of information, but we must first identify common patterns and anomalies. Why do users coming from marketing emails abandon purchases more often than those arriving via Google? Perhaps the email messaging doesn’t match the landing page.
    Why are there clicks in areas where there shouldn’t be any during CRM data entry? It might signal a UX issue.
  • Propose improvements based on those insights.
  • Repeat the above steps, implementing continuous improvement based on real data.

Practical Example of Using Session Replay to Fix Errors

One of the most common uses of this technology is troubleshooting errors in apps and software tools. When an issue occurs, session replay replaces the typically unproductive exchange between technician and user, which usually goes something like: “I don’t understand your language and I have no idea what those things you’re asking me are.”
However, when error reports come in, we can turn to session replay to see what really happened—no need for patience or the Star Trek universal translator to bridge the tech-user language gap.
With session replay, the tool shows what actually took place—what the user clicked on in the application—and confirms the universal truth: users always lie when they say they didn’t touch anything.
Let’s say there’s an error during checkout in an online store. Users report that after entering their credit card, the “Buy” button doesn’t work. With session replay, the technician observes that in 90% of the cases, users are clicking on a ghost element: a misrendered CSS overlay that loads incorrectly on iOS 16, for example. As a result, the click event never reaches the button. Additionally, the JavaScript console logs a CORS error when loading the payment gateway.
Without session replay, the issue might have been blamed on a weak client connection—resulting in lost sales. But thanks to it, the technician sees that the user clicked the invisible button 17 times due to broken CSS… and can go yell at the front-end team (whom they probably don’t consider “real” engineers anyway).

How Pandora FMS Implements Real Session Recording

Given the immense usefulness of the features discussed, Pandora FMS enables the recording, playback, and analysis of user sessions (both web and Windows-based). While it doesn’t record sessions in a “video-style” like some other session replay tools, it offers a structured and automated approach to user experience monitoring, based on recorded scripts, phase-by-phase timing, screenshots, and alerts.
For web sessions, Pandora FMS combines its WUX (Web User Experience) module, the PWRD (Pandora Web Robot Daemon) automation engine, and the Selenium IDE, enabling:

  • Recording of browser interactions.
  • Creation of scripts that automatically replay those sessions.
  • Breakdown into phases for more detailed analysis.
  • Capturing of screenshots in the event of a failure.
  • Collection of key metrics and configuration of alerts.

For Windows desktop sessions, Pandora leverages its PDR (Pandora Desktop Recorder) module to:

  • Record user actions (typing, window switches, etc.).
  • Automate desktop processes by simulating a real user.
  • Execute recorded scripts for continuous monitoring.
  • Capture the screen upon encountering errors.
  • Segment sessions by phase to obtain detailed performance metrics.

What Sets Pandora FMS Apart from Other Session Replay Tools

The way Pandora FMS captures and implements session replay capabilities goes beyond the standard features found in most tools. Its structured recording approach enables:

  • Continuous monitoring and proactive error detection, allowing issues to be resolved before they impact production environments.
  • Detailed error display and full traceability of what took place, including screenshots and step-by-step or phase-based timing data.

The key difference is that while most session replay tools passively observe what happened, Pandora FMS helps act and prevent. It programmatically replays what should happen, detecting functional deviations before real users are affected—shifting from inert playback used for post-mortem analysis to proactive prevention.
This not only reduces errors and improves user experience—turning frustrated users into happy, productive ones—but also spares IT teams from digging through endless session recordings looking for the proverbial needle in the haystack. In the end, neither the users nor the technicians will feel like smashing their keyboards in frustration.

About Version 2 Limited
Version 2 Digital is one of the most dynamic IT companies in Asia. The company distributes a wide range of IT products across various areas including cyber security, cloud, data protection, end points, infrastructures, system monitoring, storage, networking, business productivity and communication products.

Through an extensive network of channels, point of sales, resellers, and partnership companies, Version 2 offers quality products and services which are highly acclaimed in the market. Its customers cover a wide spectrum which include Global 1000 enterprises, regional listed companies, different vertical industries, public utilities, Government, a vast number of successful SMEs, and consumers in various Asian cities.

About PandoraFMS
Pandora FMS is a flexible monitoring system, capable of monitoring devices, infrastructures, applications, services and business processes.
Of course, one of the things that Pandora FMS can control is the hard disks of your computers.

Optimize Your Event Analysis: Reports, Dynamic Filters, and Log Parsing in Pandora FMS SIEM

The latest Pandora FMS version presents key improvements to the SIEM, module, designed to enhance security event detection and management. These new features are available starting with Feature Release 782, allowing for optimized log analysis, report generation, and rule validation in distributed IT environments.
The SIEM module enables organizations to work with security events that are enriched and generated through log collection and other monitoring data sources. By applying custom correlation rules, it allows you to visualize critical data to detect threats and anomalies. This feature is essential for organizations that require advanced infrastructure monitoring, integrating security event analysis as part of their cybersecurity strategy.

SIEM’s Technical Architecture in Pandora FMS

The SIEM processes events in two main phases: log and monitoring event decoding, and the generation of structured events enriched with security information, applying predefined rules in a process called decoding. This architecture makes it possible to integrate data from IDS and IPS systems and detect vulnerabilities following the CVE standard. OpenSearch works as the storage and search engine, ensuring high performance even under heavy workloads.

Once raw and encoded data is collected, correlation is performed using specific SIEM rules that allow for time-window evaluation of relationships between different rules for the same event, or correlation between multiple different events. Pandora includes thousands of default rules, though the true power of a SIEM lies in its ability to easily define custom rules or import/convert rules from similar systems for use within Pandora.

Pandora’s multi-layer architecture allows for data distribution and filtering across five levels: endpoint, collection, decoding, SIEM rule, and visualization.

Technical Documentation for SIEM in Pandora FMS

Advanced Event Analysis Reports

Three types of reports have been added to the SIEM module:

  • Event List: Detailed view of each event.
  • Historical Chart: Time-based representation of events grouped by agent, severity, or level.
  • Statistics: Numeric summary by severity.

These reports help identify patterns and prioritize actions in environments with large data volumes.
Plugins and Add-ons for Pandora FMS

Dynamic Filters in the Event Viewer

Dynamic filters have been added to the event viewer to enable advanced searches by event type, agent, or log message, simplifying incident management.

Log Parsing from the Command Line

The parse_siem_log command allows you to evaluate log lines directly from Pandora FMS CLI and preview the events generated. This tool is essential for validating decoders and rules before deployment, optimizing detection and reducin false positives. Log parsing also simplifies integration into orchestration and automated response (SOAR) processes.

Usage example:

Extended Support and Performance Optimization

The SIEM supports logs in CEF (Common Event Format), allowing the integration of data from third-party systems and devices without additional adjustments. This compatibility simplifies the centralization of security logs in heterogeneous environments. Additionally, the rule engine has been optimized to improve efficiency in event evaluation, reducing processing time and ensuring smoother performance in systems handling large data volumes.

SIEM Use Cases in Pandora FMS

The Pandora FMS SIEM enables centralized data collection and analysis from multiple sources: network devices, serversendpoints, security systems, and applications. It detects abnormal behavior patterns, generates automatic alerts for threats, and allows for real-time quick response. It simplifies incident investigation through detailed history logs and helps meet security regulations and compliance policies. Log parsing through CLI helps validate decoders and rules before deployment, improving threat detection efficiency. These capabilities strengthen protection in distributed environments, simplify security management, and optimize incident response.
The SIEM is a key component within Pandora FMS’s security architecture, which integrates advanced monitoring, log analysis, event correlation, and response tools. This combination allows organizations to adapt their environments to today’s cybersecurity challenges.

About Version 2 Limited
Version 2 Digital is one of the most dynamic IT companies in Asia. The company distributes a wide range of IT products across various areas including cyber security, cloud, data protection, end points, infrastructures, system monitoring, storage, networking, business productivity and communication products.

Through an extensive network of channels, point of sales, resellers, and partnership companies, Version 2 offers quality products and services which are highly acclaimed in the market. Its customers cover a wide spectrum which include Global 1000 enterprises, regional listed companies, different vertical industries, public utilities, Government, a vast number of successful SMEs, and consumers in various Asian cities.

About PandoraFMS
Pandora FMS is a flexible monitoring system, capable of monitoring devices, infrastructures, applications, services and business processes.
Of course, one of the things that Pandora FMS can control is the hard disks of your computers.

Change Management in Pandora ITSM with Full Traceability and Custom Workflows

With version 106 of Pandora ITSM, a critical feature has been introduced for technology environments operating under security frameworks, regulatory compliance, and efficient management: Change Management. This new module allows changes to be registered, approved, implemented, and closed in a structured way, with full traceability and responsibility control.


New ITSM Feature: Integrated Change Management

Controlling changes in IT is no longer optional. It’s a requirement for minimizing operational risks, avoiding human errors, and complying with standards such as ISO 27001, ENS, or SOC2. Many serious incidents originate from poorly managed changes: urgent interventions without documentation, informal approvals, or tasks that fall outside the scope of operational oversight.
The new Change Management feature in Pandora ITSM structures this entire process. From a single interface, you can define the change, document it, assign it, monitor it, and close it, ensuring that every action is properly recorded. The system is designed to adapt to different types of changes (routine, planned, or critical) and fit the realities of each team: roles, permissions, automations, and specialized teams.

Its complete integration with tasks, tickets, inventory, and projects makes it a natural part of the ITSM ecosystem, rather than a standalone component.

What Can You Do Now with Pandora ITSM?

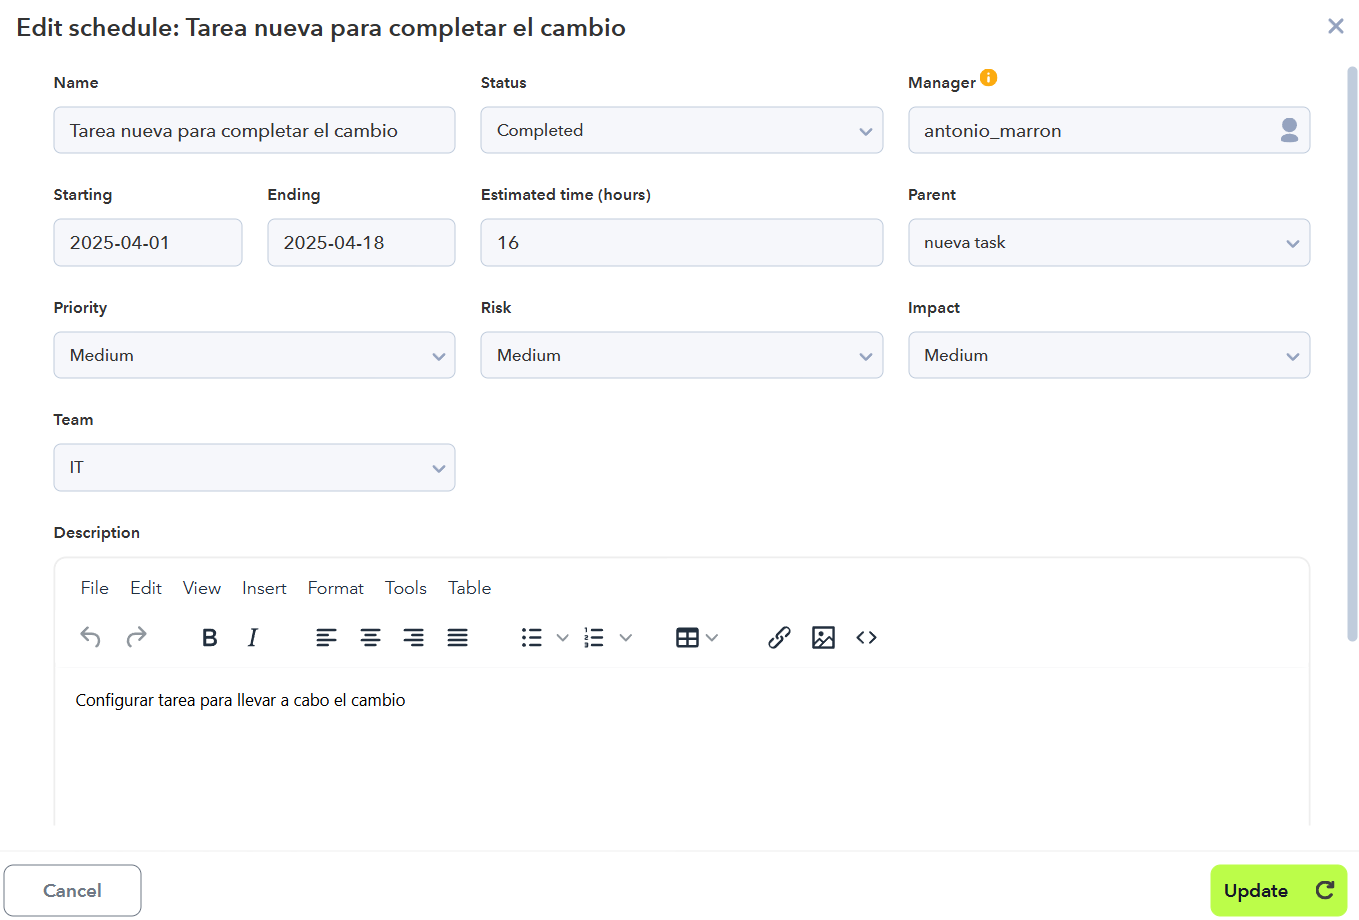
Change Management is not just a record—it’s a complete work cycle with its own statuses, validations, and rules. In Pandora ITSM, the cycle starts with the creation of a request where you can define key fields such as priority, risk, impact, manager, and responsible team.
From there, the change can include:

  • Linked inventory items directly associated with the change.
  • Attached files containing technical documentation or approvals.
  • Non-billable internal notes, useful for coordination without affecting SLAs.
  • Association with specific tickets and tasks, with granular control over time and effort tracking.

Each change follows a defined state flow (New, Authorized, Scheduled, Implement, Review, Closed), with automatic transitions based on task execution. Managers can review the progress at any time, view actual time spent, and audit every step from the Tracker section.

Additionally, you can create reusable change templates, automate notifications based on events, and define change teams with role-based access controls. This allows you to manage everything from low-impact technical changes to critical interventions that require coordination across multiple departments.


Supported Change Types

The system supports three change types, aligned with IT change management best practices:

  • Standard Change: Routine, low-risk changes that can be pre-approved and executed without additional review—for example, a scheduled system reboot.
  • Normal Change: Changes that require formal assessment before execution, involving planning, approval, and final validation.
  • Emergency Change: Critical changes that must be executed immediately due to operational or security reasons, but are still documented and traceable.

The change type defines the initial flow of the process. For example, a standard change moves directly to the Authorized state if created from a template, skipping unnecessary steps while maintaining full traceability.

Automate and Control the Entire Workflow

One of Pandora ITSM’s key strengths is its ability to automate change management without sacrificing control. Some of the core features include:

  • Change templates that pre-configure fields like priority, risk, or impact based on the type of intervention.
  • Custom states for tasks and changes, with built-in logic and validations.
  • Automatic notifications that alert teams when there are pending tasks or required actions.
  • Change teams with hierarchical structure, group email notifications, and advanced access control through ACLs.
  • Workunits to record exact time spent, link it to tasks, and consolidate it into reports.

This entire ecosystem is managed from the Changes Administration sections, where you can define types, states, priorities, risks, templates, and notifications.

What Makes It Different?

Unlike other tools that treat change as a standalone component, Pandora ITSM fully integrates change management with all key operational processes:

  • Linked to inventory, allowing full visibility into affected assets.
  • Connected to projects, enabling change tasks to be part of larger initiatives.
  • Integrated with tickets, so incidents can generate changes, and changes can be tracked through actual execution.
  • Leveraging ITSM’s permission structure, ensuring that no user acts outside of their defined role.

This transforms change management into a true governance and efficiency tool, far beyond basic compliance. The complete log of actions, decisions, tasks, and time spent allows teams to pass audits, evaluate performance, and continuously improve control over the technical environment.

Closure

With this new feature, Pandora ITSM brings change management from theory into real operational practice. It’s no longer about filling out a form or logging a task in a shared Excel file. Every change is controlled from start to finish, with roles, validations, documentation, and monitoring—all fully integrated into your organization’s actual workflows.
In environments where compliance, traceability, and service stability are critical, having a solution that automates, logs, and controls changes is not a competitive advantage—it’s an operational necessity.
Available starting with version 106.
You can find more details in the official Pandora ITSM documentation or log into the console and explore the Changes menu.

Pandora-favicon-2025

Pandora FMS’s editorial team is made up of a group of writers and IT professionals with one thing in common: their passion for computer system monitoring. Pandora FMS’s editorial team is made up of a group of writers and IT professionals with one thing in common: their passion for computer system monitoring.


About Version 2 Limited
Version 2 Digital is one of the most dynamic IT companies in Asia. The company distributes a wide range of IT products across various areas including cyber security, cloud, data protection, end points, infrastructures, system monitoring, storage, networking, business productivity and communication products.

Through an extensive network of channels, point of sales, resellers, and partnership companies, Version 2 offers quality products and services which are highly acclaimed in the market. Its customers cover a wide spectrum which include Global 1000 enterprises, regional listed companies, different vertical industries, public utilities, Government, a vast number of successful SMEs, and consumers in various Asian cities.

About PandoraFMS
Pandora FMS is a flexible monitoring system, capable of monitoring devices, infrastructures, applications, services and business processes.
Of course, one of the things that Pandora FMS can control is the hard disks of your computers.

Enhance Security with SAML: Pandora FMS Now Supports Azure Entra ID

In modern enterprise environments, access management is key to ensuring security and regulatory compliance (ENS, ISO 27001, NIS2, etc.). That’s why Pandora FMS has added support for Azure Entra ID, enabling authentication through SAML (Security Assertion Markup Language). With this integration, we provide simplified and secure access to our platform using Single Sign-On (SSO).

What is SAML and Why Is It Important?

SAML is an open XML-based standard that enables the exchange of authentication and authorization data between an Identity Provider (IdP) and a Service Provider (SP). This means users can authenticate once and gain access to multiple applications without needing to log in repeatedly.
Implementing SSO with SAML in Pandora FMS provides several key benefits:

  • Enhanced security: Reduces reliance on weak or reused passwords, lowering the risk of compromised credentials.
  • Improved user experience: Enables seamless access across different platforms, simplifying the login process for employees, partners, and customers.
  • Regulatory compliance: Supports the adoption of Zero Trust policies and centralized access management.

Integration with Azure Entra ID

Compatibility with Azure Entra ID allows Pandora FMS to integrate with Microsoft’s identity solution, providing centralized control over user authentication. This enables:

  • Centralized authentication for all users in enterprise environments.
  • Automated access management based on roles and permissions defined in Entra ID.
  • Reduced security risks through multi-factor authentication and advanced access policies.

Implementing this functionality allows organizations to align their infrastructure with modern security principles, reduce the attack surface, and ensure controlled access to critical systems.

Configuration in Pandora FMS

To configure SAML with Azure Entra ID in Pandora FMS, communication between both platforms must be established by defining the identity provider and the service provider. This involves creating and configuring an application in Entra ID, assigning the appropriate permissions, and integrating it with the SAML settings in Pandora FMS.
The detailed configuration procedure, including specific steps and advanced options, is available in the Pandora FMS technical documentation, where each required parameter for implementation is thoroughly explained.
With this new feature, we strengthen identity management security and efficiency within Pandora FMS. Compatibility with Azure Entra ID is another step in our commitment to enterprise security, helping organizations optimize authentication and improve access control.

The integration of Pandora FMS with Azure Entra ID not only enhances security but also complements the monitoring capabilities for Microsoft Azure infrastructures. Credential and access management, combined with advanced monitoring, allows businesses to optimize operations and effectively reduce risk.


About Version 2 Limited
Version 2 Digital is one of the most dynamic IT companies in Asia. The company distributes a wide range of IT products across various areas including cyber security, cloud, data protection, end points, infrastructures, system monitoring, storage, networking, business productivity and communication products.

Through an extensive network of channels, point of sales, resellers, and partnership companies, Version 2 offers quality products and services which are highly acclaimed in the market. Its customers cover a wide spectrum which include Global 1000 enterprises, regional listed companies, different vertical industries, public utilities, Government, a vast number of successful SMEs, and consumers in various Asian cities.

About PandoraFMS
Pandora FMS is a flexible monitoring system, capable of monitoring devices, infrastructures, applications, services and business processes.
Of course, one of the things that Pandora FMS can control is the hard disks of your computers.

New Discovery with NetScan for Automated Asset Management in Pandora FMS NG 781 RRR

About Version 2 Limited
Version 2 Digital is one of the most dynamic IT companies in Asia. The company distributes a wide range of IT products across various areas including cyber security, cloud, data protection, end points, infrastructures, system monitoring, storage, networking, business productivity and communication products.

Through an extensive network of channels, point of sales, resellers, and partnership companies, Version 2 offers quality products and services which are highly acclaimed in the market. Its customers cover a wide spectrum which include Global 1000 enterprises, regional listed companies, different vertical industries, public utilities, Government, a vast number of successful SMEs, and consumers in various Asian cities.

About PandoraFMS
Pandora FMS is a flexible monitoring system, capable of monitoring devices, infrastructures, applications, services and business processes.
Of course, one of the things that Pandora FMS can control is the hard disks of your computers.

Monitoring in Hyperconverged Infrastructures: Challenges and Solutions

About Version 2 Limited
Version 2 Digital is one of the most dynamic IT companies in Asia. The company distributes a wide range of IT products across various areas including cyber security, cloud, data protection, end points, infrastructures, system monitoring, storage, networking, business productivity and communication products.

Through an extensive network of channels, point of sales, resellers, and partnership companies, Version 2 offers quality products and services which are highly acclaimed in the market. Its customers cover a wide spectrum which include Global 1000 enterprises, regional listed companies, different vertical industries, public utilities, Government, a vast number of successful SMEs, and consumers in various Asian cities.

About PandoraFMS
Pandora FMS is a flexible monitoring system, capable of monitoring devices, infrastructures, applications, services and business processes.
Of course, one of the things that Pandora FMS can control is the hard disks of your computers.

What Is Snort, How It Works, and Its Integration with SIEM for Cybersecurity

About Version 2 Limited
Version 2 Digital is one of the most dynamic IT companies in Asia. The company distributes a wide range of IT products across various areas including cyber security, cloud, data protection, end points, infrastructures, system monitoring, storage, networking, business productivity and communication products.

Through an extensive network of channels, point of sales, resellers, and partnership companies, Version 2 offers quality products and services which are highly acclaimed in the market. Its customers cover a wide spectrum which include Global 1000 enterprises, regional listed companies, different vertical industries, public utilities, Government, a vast number of successful SMEs, and consumers in various Asian cities.

About PandoraFMS
Pandora FMS is a flexible monitoring system, capable of monitoring devices, infrastructures, applications, services and business processes.
Of course, one of the things that Pandora FMS can control is the hard disks of your computers.

Pandora FMS Stands Out in G2 Spring 2025 Reports: 35 Key Recognitions in Monitoring and Cybersecurity

About Version 2 Limited
Version 2 Digital is one of the most dynamic IT companies in Asia. The company distributes a wide range of IT products across various areas including cyber security, cloud, data protection, end points, infrastructures, system monitoring, storage, networking, business productivity and communication products.

Through an extensive network of channels, point of sales, resellers, and partnership companies, Version 2 offers quality products and services which are highly acclaimed in the market. Its customers cover a wide spectrum which include Global 1000 enterprises, regional listed companies, different vertical industries, public utilities, Government, a vast number of successful SMEs, and consumers in various Asian cities.

About PandoraFMS
Pandora FMS is a flexible monitoring system, capable of monitoring devices, infrastructures, applications, services and business processes.
Of course, one of the things that Pandora FMS can control is the hard disks of your computers.

Windows Monitoring with Sysmon: Practical Guide and Configuration

One might think that, considering how effective some companies are at logging everything we do to serve us ads, they’d at least apply that to help us understand what’s happening on our systems and monitor their performance and security. But in the case of Windows, traditional logs fall short — and that’s where the importance of Sysmon comes in.
Sysmon is a Windows service that logs operating system activity into the event log. However, it’s not installed by default, so you’ll need to download it from here.
Once installed, Sysmon logs are significantly more advanced and comprehensive than the default Windows Event Log, which is critical for ensuring the security of your systems.
That’s why we’re taking a deep dive into Sysmon.

How to Install Sysmon

Sysmon isn’t installed like a common Windows program, and here are the steps to do it without running into weird errors:

  • Run PowerShell as Administrator.
  • Use the command line to navigate to the location where you retrieved the previously linked Sysmon file.
  • Then run: .\Sysmon64.exe -i -accepteula
  • You’ll see some installation messages, and just like that, Sysmon will be up and running.

Sysmon Log Location and Management

So, how can we view Sysmon logs? Microsoft enjoys hiding things from us, but it’s “easy”:

  • Press the Windows key and search for Event Viewer, then open it.
  • You’ll see several folders — go to: Applications and Services Logs.
  • Open the Microsoft folder, then the Windows folder.
  • In the central panel, scroll down until you find Sysmon, then click on it. You’ll see a log named Operational, which you may manage using the options on the right-hand side. Click to open it.
  • Everything that’s happening is recorded there, and you can select events, copy them, save them, etc.

Why Sysmon Logs Are Essential for a SIEM

With Sysmon’s detailed logging, our SIEM— such as Pandora SIEM — can analyze and correlate those records, detecting and alerting the SOC about threats that would otherwise go unnoticed with basic logs..

For example, a process hollowing attack — where a malicious actor creates a “legitimate” process like svchost.exe, but injects it with malicious code — would likely slip past default event logs, assuming they haven’t been disabled altogether.
But thanks to Sysmon, our SIEM can detect and raise alerts for this and other techniques by analyzing its logs. That’s why in today’s security landscape, Sysmon is essential if you’re managing Windows systems and dealing with threats more advanced than a basic DDoS attack.

Events Logged by Sysmon

With Sysmon, we go from logging almost nothing to logging nearly everything. The service assigns an Event ID number to each type of activity it monitors, and these are the events it records:

  • 1: Process creation.
  • 2: A process changed the creation time of a file.
  • 3: Network connection.
  • 4: Sysmon service state changed.
  • 5: Process terminated.
  • 6: Driver loaded.
  • 7: Image loaded.
  • 8: CreateRemoteThread.
  • 9: RawAccessRead.
  • 10: ProcessAccess.
  • 11: FileCreate.
  • 12: RegistryEvent (object creation and deletion).
  • 13: RegistryEvent (value sets).
  • 14: RegistryEvent (key and value names).
  • 15: FileCreateStreamHash.
  • 16: ServiceConfigurationChange.
  • 17: PipeEvent (pipe created).
  • 18: PipeEvent (pipe connected).
  • 19: WmiEvent (WmiEventFilter activity detected).
  • 20: WmiEvent (WmiEventConsumer activity detected).
  • 21: WmiEvent (WmiEventConsumerToFilter activity detected).
  • 22: DNSEvent (DNS query).
  • 23: FileDelete (archived file deletion).
  • 24: ClipboardChange (new clipboard content).
  • 25: ProcessTampering (image change in a process).
  • 26: FileDeleteDetected (logged file deletion).
  • 27: FileBlockExecutable.
  • 28: FileBlockShredding.
  • 29: FileExecutableDetected.
  • 255: Error — reserved for when Sysmon fails to complete a task or encounters other issues.

As you can see, it logs everything from file creation and modification, to clipboard activity and network requests. With this granular logging, we can correlate events that may appear harmless on their own but together may be the signs of a sophisticated attack.

Sysmon Log Lifecycle

To manage logs efficiently, we need to define what happens at each stage of their lifecycle.
Sysmon begins recording events in real time based on the configuration defined in an XML file.
By default, it uses a generic configuration to start logging, but the real power—and what any SOC truly cares about—is customizing that XML to suit the organization’s needs security policies risk management approach, and infrastructure (such as the SIEM being used).
This allows us to configure Sysmon to ignore irrelevant “noise” and focus only on what matters.
Once event logging begins, entries are stored until the log reaches its maximum defined size, which can be adjusted through the Event Viewer.
To configure this, navigate again to Operational, right-click it, select Properties, and there you can define:

  • Maximum log size.
  • What happens when the limit is reached: Overwrite events starting with the oldest, archive the log so it won’t be overwritten, or choose not to overwrite at all (because you’ll manually clear the logs—something you probably promise to do and never will).

These logs reach their full potential when analyzed by a SIEM, Manually going through every Sysmon line for clues might build character—but also eye strain—and is much slower and more error-prone than letting a SIEM handle it, implying a high risk of overlooking issues such as malware.
For example, Pandora SIEM’s agent collects these logs and sends them to a centralized server for analysis and correlation alongside other logs—without burning through your eyelashes. This allows you to detect real-time threats that might be buried within endless log lines, and correlate them with other activity across the network, even from non-Windows machines.
Even better: if the Windows endpoint is compromised beyond recovery, you’ll still have a centralized copy of the log in your SIEM, which is vital for forensic analysis to understand what caused the catastrophic failure.
And what happens to the logs once they’ve been analyzed?
That depends on finding the right balance between smart archiving and deletion, and meeting both forensic investigation needs and regulatory compliance regarding long-term log retention.

How Eventlog Analyzer Processes Sysmon Logs

A Sysmon log captures a vast amount of information, but what we truly need is actionable insight for our defense strategies. To achieve this, various tools can leverage Sysmon logs to detect malicious patterns and alert us accordingly.
Eventlog Analyzer, a tool by ManageEngine, includes powerful log analysis capabilities—not just for Sysmon, but also for routers, IDS systems, and more.
It normalizes, correlates, and presents the most relevant data visually through dashboards and alerts.
This simplifies threat detection, forensic investigations during security breaches, and ensures compliance with regulatory requirements.

Monitoring Sysmon with Pandora FMS and Pandora SIEM

Pandora SIEM also enables centralized and advanced analysis of Sysmon logs (as well as logs from other areas of your IT infrastructure) via the Log Collector. It then transforms that information into actionable insights and quickly detects threats, It doesn’t matter if you’re running both Windows and Linux machines, and Sysmon data needs to work in harmony with Syslog or Auditd—everything gets integrated and analyzed together.
One of Pandora’s strongest features is its adaptability— you can fully tailor the tool to match your workflows, organization structure, and specific needs.
Similarly, Pandora dashboards can be configured to display exactly what matters to you—such as listing Sysmon events sorted by severity —and alert you only when needed, filtering out the noise.
It also provides advanced reporting and search capabilities, going far beyond the features offered by many other tools.
Pandora is a comprehensive solution—think of it as the Enterprise’s central computer—designed to monitor and manage diverse systems so they run in sync. Its SIEM is synonymous with top-tier security, but you can also incorporate remote monitoring, control, and ticketing into a single unified platform.
This prevents your stack from turning into a Frankenstein’s monster of stitched-together tools—something all too common in IT—which also brings the added headache of fragmented support, where each vendor blames “the other applications.”

How to Properly Configure Sysmon

With great power comes great responsibility… and complexity. That’s why anyone who needs to filter out “noise” and receive only critical information from Sysmon should use a custom XML configuration.
You can do this with the following command:

.\Sysmon64.exe -i -accepteula c:\micarpeta\mixmlpersonal.xml

But writing that XML from scratch can feel like one of Hercules’ labors—which is why Pandora provides a starter configuration file, which you can download here.
This file is based on best practices and specially adapted to help Pandora extract the key information necessary for effective protection. However, it should always be tailored to fit your environment.
The file comes well-commented (which makes working with it much easier) and includes some Pandora-specific rules, but you can and should customize it as needed.
Some key points in the XML you may want to adapt include:

  • Critical processes (search for
  • Ports commonly used by attackers (search for <destinationport…) —=”” keep=”” an=”” eye=”” on=”” suspicious=”” ports=”” like=”” 4444,=”” often=”” used=”” by=”” metasploit.<=”” li=””>
    </destinationport…)>
  • Registry modifications (search for <targetobject…).< li=””>
    </targetobject…).<>
  • Executables launched from suspicious locations, like /temp or the Recycle Bin.

Becoming familiar with the XML format, its structure, and the meaning of each field is one of the best skills you can develop for protecting Windows systems.
This way, you can ensure that Sysmon’s potential doesn’t go to waste, quietly collecting gigabytes of dusty virtual logs.
As we’ve seen, if you manage Windows endpoints, Sysmon is essential—because while Microsoft might know everything about us, the default event logs leave us knowing little about Windows itself. That’s why you need to start logging with Sysmon—but don’t stop there.
Its massive logging capabilities are also its biggest challenge, which is why the best approach is to customize its XML and integrate it with a SIEM. The SIEM can then do the heavy lifting of detecting threats hidden among the thousands of log lines

About Version 2 Limited
Version 2 Digital is one of the most dynamic IT companies in Asia. The company distributes a wide range of IT products across various areas including cyber security, cloud, data protection, end points, infrastructures, system monitoring, storage, networking, business productivity and communication products.

Through an extensive network of channels, point of sales, resellers, and partnership companies, Version 2 offers quality products and services which are highly acclaimed in the market. Its customers cover a wide spectrum which include Global 1000 enterprises, regional listed companies, different vertical industries, public utilities, Government, a vast number of successful SMEs, and consumers in various Asian cities.

About PandoraFMS
Pandora FMS is a flexible monitoring system, capable of monitoring devices, infrastructures, applications, services and business processes.
Of course, one of the things that Pandora FMS can control is the hard disks of your computers.

EDR and Endpoint Security

Endpoints are the primary target of cyberattacks. The most conservative estimates indicate that between 68% and 70% of data breaches begin on these devices. This is why implementing an EDR (Endpoint Detection and Response) solution is crucial to protect them in today’s cyber threat landscape.
An EDR is an advanced security tool installed on the end devices of the technological infrastructure (personal computers, servers, phones…) that monitors their activity in real-time, providing visibility into exactly what is happening on each of these endpoints.
This makes it possible to detect, analyze, and respond to security threats proactively and smartly. In case of an incident, it also allows the response team to have all the necessary information to dig into and solve the issue.
This goes beyond the capabilities of a traditional antivirus, which is normally used to protect some endpoints but falls short in the current security context faced by organizations.


How an EDR Works

The features of an EDR and the level of endpoint security they provide ultimately depend on each manufacturer, but they all rely on three fundamental pillars, which help to understand how they work and the protection they offer:

  • Activity monitoring on a steady basis: This includes everything from processes to device connections, collecting data and analyzing it intelligently.
  • Threat detection: When the monitoring system detects abnormal behavior, such as lateral movements, malware, phishing attempts, and other malicious actions.
  • Automated response to threats: This may involve isolating the compromised device from the rest of the network, blocking suspicious processes, or deleting harmful files.

EDRs differ from traditional antiviruses not only in their detection capabilities (being able to face unknown and sophisticated threats) but also in their response capabilities, such as isolating a device from the network. On the other hand, antivirus usually quarantines or deletes an infected file at best.
For instance, a malicious actor might create a new type of malware conceived to retrieve critical data from an organization, such as credentials or privileged information.
While an antivirus might not recognize malware and allow it to operate unchecked, an EDR can detect malicious file’s activity, such as data leaks. It can then stop the process if it detects an unknown connection and a massive flow of data going to it.
A similar situation could take place if data exfiltration is attempted by a disgruntled employee without any malware involved.
A certain user might try to copy information to an external device. While an antivirus wouldn’t react to this, an EDR could detect the connection of a USB drive or the unusual behavior of a large-volume data transfer, and then take the appropriate action against this suspicious activity.

Differences Between Security Management and Infrastructure Management

To ensure optimal endpoint protection and overall system security, it is key to understand the difference between these two concepts and ensure they are aligned.
Infrastructure management aims to ensure that the technological environment works properly and supports the organization’s goals. However, this objective is compromised if security is not also a key consideration.

On the other hand, security management involves implementing measures and policies to protect the infrastructure, such as integrating SIEM (Security Information and Event Management) and EDR (Endpoint Detection and Response) solutions. However, it is not the same to secure a straw building thrown together haphazardly as it is to protect a well-planned stone castle.
Likewise, an adequately managed technological infrastructure will make the following possible:

  • Security management.
  • Integrated operation of EDR and SIEM.
  • The effectiveness of the blue team, if present.
  • Incident response.

Let’s look at an example illustrating the difference between a well-managed infrastructure and an unprotected one.
Imagine an environment with proper network segmentation, strong device access controls, and a consistent patch management policy.
Even if an infrastructure element fails (for instance, a delayed firmware update on an IoT device due to a vulnerability), if that device has been configured with appropriate network and access policies, it will still contribute to overall security. This setup reduces the likelihood that a malicious actor who compromises that endpoint can move laterally to another, more critical part of the network.
Moreover, if this proper infrastructure management is combined with effective security management using an EDR integrated with a SIEM solution, any attempt at unusual lateral movement would be detected, alerted, and mitigated.
Conversely, if that IoT device still uses the default username and password (an all-too-common situation unfortunately) or has unrestricted network access, a malicious actor will have significant opportunities to move through the network to critical systems or compromise the device in other ways, such as spying through a webcam.

Infrastructure Management Approaches to Strengthen Security

Continuing with the previous analogy, how do we build our castle with robust stone and a resilient design?
An effective infrastructure management strategy would involve the following practical approaches:

  • Strict update and patching policies: To prevent malware or exploit techniques from taking advantage of vulnerabilities in outdated versions. This includes updating both software and firmware on endpoints.
  • Optimal network design: By properly segmenting networks and ensuring that each device has access only to what is strictly necessary for its function—both in terms of data and communication with other devices.
  • Implementation of SIEM solutions: To collect data on what is happening within our infrastructure, consolidate that information for the Network Operations Center (NOC) analyze it, and alert on any suspicious activity.
  • Log monitoring and analysis policies: To detect anomalies within those logs. Currently, security policies allow companies to meet the highest security standards and certifications, such as ISO 27001 as well as government regulations like the new NIS2, which is being implemented by lots of companies.

With these measures in place, our infrastructure becomes more resilient to attacks while continuing to fulfill its primary purpose: supporting organizational goals and workflows.
There is often talk of having to choose between security and convenience or security and performance, but this is a false dichotomy. Proper infrastructure management supports both security and operability—there is no need to choose between them. While system infrastructures and hybrid environments make it hard to get a unified overview, Pandora FMS unifies data sources and allows centralized management.

How Different EDRs and Antivirus (A/V) Solutions Approach Security

Although we often talk about EDRs and antivirus solutions as two general approaches to endpoint security, not all products are created equal.
Therefore, it is essential to understand the key features of each solution and how they may vary depending on the manufacturer.

EDRAntivirus
Constant activity monitoring on endpoints to detect suspicious behaviors.It scans files and applications looking for known malware brands.
It uses behavioral analysis to identify unknown threats.It uses file definition databases to identify known malware.
Some options use predictive AI, such as Pandora FMS, to detect and make decisions.Some manufacturers use heuristics (suspicious behavior predefined rules), an older technology that generates more false positives.
Sophisticated automated response: it may isolate devices, block suspicious processes and generate advanced alerts (the scope of said response will depend on the features of each manufacturer).Limited automated response to quarantine or infected file deletion.
Advanced forensics capabilities, logging everything that happened to make audits easier as well as the work of the incident response team.Forensics capabilities limited to logging basic detections.
Active and reactive protection.Reactive protection based on the definition file.
High integration capacity with SIEM and the infrastructure in general.Limited integration.

This last aspect of SIEM and EDR integration is critical today and the key to security in such a constantly evolving environment.

However, on the other side of the scale, the capabilities of antivirus solutions are much more limited, both in terms of the information they can send to a SIEM and their integration capacity with these systems. Additionally, some antivirus solutions are prone to compatibility issues with the rest of the technological or security infrastructure, leading to conflicts with firewalls or other protection tools.

Advantages and Disadvantages of an EDR Compared to a Traditional Antivirus

The above does not mean that everything is that positive in the case of EDRs, so an impartial analysis should put these advantages on the table, but also the disadvantages and challenges.

Advantages of an EDR Compared to an Antivirus

  • Advantages of an EDR Compared to an Antivirus against both known and unknown threats.
  • More advanced automated incident response capabilities.
  • Enhanced security management through detailed visibility into exactly what is happening on each endpoint.

Disadvantages of an EDR Compared to an Antivirus

  • More complex to implement and manage.
  • It requires skilled personnel to interpret and respond to incidents, as well as for installation and integration, especially in on-premise solutions.
  • Generally higher cost.

Advantages of an Antivirus Compared to an EDR

  • Easier and faster to implement.
  • Effective against known malware and common threats.
  • More affordable than EDRs, and sometimes even free.

Disadvantages of an Antivirus Compared to an EDR

  • Insufficient protection in the current cybersecurity landscape, especially for scenarios beyond low-risk individual users.
  • It may cause management issues, such as false positives or conflicts with other applications.
  • Very limited response capability to security incidents.

Practical Approaches for Endpoint Security in On-Premise Environments

Whether due to legal requirements, such as protecting and managing sensitive data, or due to a strategic technology approach, such as the need for greater control or equipment performance, on-premise solutions are gaining appeal compared to a 100% cloud-based approach.
Therefore, it is important to consider these fundamental strategies for successfully implementing EDR solutions in on-premise environments.

  • Analysis and Assessment of Infrastructure Needs. Every truly strategic action, of any kind, begins with this step. It is essential to have a thorough understanding of your network, its critical assets, and the primary threats you face, which will shape a significant part of your specific threat model, differing from that of other organizations.
  • Choosing the Right EDR Solution. Based on the conclusions from the previous point and your budget.


  • Initiating a Testing Phase. In a controlled environment that allows you to evaluate whether the chosen solution is appropriate.
  • Establishing a Gradual Deployment Strategy. Even if tests are successful, it is crucial to proceed gradually to identify and solve any issues and challenges that will inevitably arise.
  • Integration with Other Tools. Particularly with SIEM, configuring rules and verifying their effectiveness.
  • Setting Up a Robust Monitoring and Auditing Policy. The tool alone is ineffective without a solid process behind it, making it essential to systematize monitoring and control tasks.
  • Establishing Contingency Plans. What would happen if everything failed? Security must always consider this question, even when applying best practices, as the probability of unexpected black swan events is never zero. For such scenarios, it is necessary to have a “red button” plan that allows for operation continuation and the restoration of data and infrastructure as quickly as possible.

While the on-premise approach is gaining traction again, nothing is absolute, so a hybrid solution can also be considered.
Therefore, here are the differences between a 100% on-premise implementation, a hybrid one, and a 100% cloud-based solution.

  • 100% On-Premise: The security infrastructure is located within the organization’s premises. Its main benefit is complete control over data, devices, and security, as well as potentially better performance and lower latency. However, the challenge is that it is more expensive in terms of economic and human resources. These resources, besides being more numerous, also require higher qualifications and will perform more intensive management tasks. It is worth noting that, often due to ENS or NIS2 requirements, certain pieces of infrastructure must be on-premise.
  • Hybrid Implementation: It combines on-premise and cloud elements. The key is to leverage the best of both worlds, for example, by keeping sensitive data locally while managing threat analysis and response in the cloud. A well-planned hybrid approach allows cost reduction and increased flexibility. The biggest challenge is that we will not rely solely on ourselves, as there will be points of failure beyond our control.
  • 100% Cloud-Based: Its main benefit is reduced economic and human costs, as well as lower technological complexity, which rests with the cloud provider. The downside is that we place the most critical aspects in the hands of third parties, in whom we must trust. And in case of an incident, we also depend on their response capabilities.

This is no small matter, and the echoes of July 19, 2024, still resonate in every security manager’s mind. On that morning, millions of Windows systems displayed the infamous blue screen of catastrophic failure, caused by a faulty remote update from CrowdStrike, one of the most well-known EDRs.

How Pandora FMS Enhances Endpoint Security

Throughout this journey, we have emphasized that EDR solutions are more advanced but only as effective as the real-time monitoring and threat detection capabilities we have in place.
This is where the next link in the security chain connects: with a flexible monitoring system like Pandora FMS, which complements endpoint security.

How?

  • By integrating with Pandora SIEM, which collects and centralizes everything, providing a clear overview of what is happening at all times.
  • Through log analysis and audits, which further strengthen endpoint protection. Every company is unique, as are its specific threats. This means that we must have complete visibility into our infrastructure, its unique characteristics, and any suspicious deviations from the norm, which will differ from those of other organizations.
  • With advanced security event correlation, to effectively identify anomalies in our specific case and respond appropriately.
  • Through seamless integration with network devices and firewalls, ensuring that everything operates smoothly.
  • By collecting events from agents on multi-platform endpoints (Windows, macOS or Linux).

As we have seen, for any organization that takes security seriously, using EDR along with a SIEM strategy is essential.
The cyber threat landscape changes frequently and quickly. Attacks are becoming more frequent, and malicious actors are getting more sophisticated. Supported by the emergence of AI, even adversaries with limited technical knowledge can now modify malware to compromise defenses and evade traditional detection systems, such as antivirus solutions. They can even create new malicious programs from scratch.
Therefore, threats that were once exclusive to highly skilled and motivated actors are now within reach of many. This underscores the importance of designing our infrastructure with resilience in mind and integrating security measures capable of anticipating this ever-changing landscape.
Without this approach, we risk facing an increasingly hostile and complex environment unprotected every single day.


About Version 2 Limited
Version 2 Digital is one of the most dynamic IT companies in Asia. The company distributes a wide range of IT products across various areas including cyber security, cloud, data protection, end points, infrastructures, system monitoring, storage, networking, business productivity and communication products.

Through an extensive network of channels, point of sales, resellers, and partnership companies, Version 2 offers quality products and services which are highly acclaimed in the market. Its customers cover a wide spectrum which include Global 1000 enterprises, regional listed companies, different vertical industries, public utilities, Government, a vast number of successful SMEs, and consumers in various Asian cities.

About PandoraFMS
Pandora FMS is a flexible monitoring system, capable of monitoring devices, infrastructures, applications, services and business processes.
Of course, one of the things that Pandora FMS can control is the hard disks of your computers.