
Skip to content

How to Optimize MPLS Network Monitoring to Improve Performance and SLAs

Introduction to MPLS and its Relevance in Business Networks


What is MPLS? 

In the IT infrastructure serving increasingly digitized enterprises, the criticality of network quality of service is more than evident to ensure connectivity to everyone at any time. System and network administrators need to understand which technology enables efficient, reliable, and lowest latency data transmission between IT applications and services. That’s why we’re introducing the MPLS method (Multiprotocol Label Switching), which refers to “switching” or multiprotocol label switching (circuit-switched networks and packet-switched networks). That is because MPLS integrates network link information (bandwidth, latency, network usage) with IP (Internet ProtocolInternet Protocol) within a particular system (an ISP, Internet Service Provider) to simplify and improve IP packet exchange. Unlike traditional, IP-based networks, MPLS uses a tag system to manage traffic on the network more quickly and effectively.

Importance of MPLS in Network Infrastructures for Businesses Seeking to Reduce Latency and Improve Reliability

For a comprehensive resilient connectivity strategy, the value of MPLS lies in the ability to assist operators in the proper management of network resources, from tags, to divert and route traffic flexibly and according to business needs, achieving greater speed and reducing latency, while avoiding link failures, network congestion and bottleneck generation.

Advantages of MPLS for IT Infrastructures

As we have seen, the primary goal of MPLS is to significantly simplify routing and improve overall network performance.

Among its advantages, there are the following:

  • Improvement in Quality of Service (QoS)
    From a QoS perspective, ISPs help manage different types of data flows based on priority and service plan. For example, there are different needs for a business area with a premium service plan or that receives a large amount of streaming (or high-bandwidth) multimedia content, and may experience latency in the network service. When entering packets into an MPLS network, Label Edge Routers (LER) assign a label or identifier that contains information based on the routing table input (i.e. destination, bandwidth, latency, and other metrics) and references the IP header field (source IP address), the socket number information and the differentiated service. Each core router uses tags to determine the most efficient path to its destination. That is, switching is being performed based on labels and their priority, so that data packets move throughout the network accurately and quickly. It should be noted that QoS metrics include parameters such as bandwidth, delay, jitter, packet loss, availability, and reliability, which reflect network features and performance, as well as traffic. What’s relevant about this is that MPLS supports QoS mechanisms that prioritize critical traffic, ensuring that high-priority applications benefit from bandwidth optimization and low latency.
  • SLA Compliance in Distributed Networks
    In service management, compliance with the commitments set out in a Service Level Agreement (SLA) must be monitored. By using MPLS, it is possible to ensure network performance by enabling the creation of dedicated paths for data packets. This ensures that network performance metrics (latency, jitter, and packet loss) are implemented consistently. MPLS networks are also designed with redundancy and failover capabilities, which improve network reliability and uptime. The sum of this ensures that network operability remains operational and meets the availability targets specified in the SLAs.
  • Bandwidth Usage Efficiency and Traffic Prioritization
    MPLS networks provide strong tools for monitoring and managing network performance, as tags are used to route packets through the network. Each package is assigned a label that states its path and priority. Compared to traditional routing, MPLS is more efficient as it allows traffic engineering to be implemented, helping network operators optimize data flow through the network. By controlling the paths that data packets take, MPLS can avoid congestion and ensure that high-priority traffic is delivered efficiently. MPLS also allows adopting (CoS, Class of service), which is a parameter used in data and voice protocols, critical for many business applications. This is because MPLS helps to classify and manage traffic based on predefined classes of service, according to their criticality and the level of service required. For that reason, service providers may address issues more proactively with MPLS and even easily scale to accommodate growing network demands without compromising network performance.

MPLS vs. emerging technologies such as SD-WAN

When it comes to network management, as experts say, the choice between MPLS, SD-WAN, and emerging technologies should be based on the specific needs and context of the organization.

Comparison between MPLS and SD-WAN

To be able to compare these methods, we must first consider that software-defined wide area networks (SD-WAN) use virtualization technology to apply the advantages of software-defined networks, unlike traditional networks, which are hardware-based and router-centric to direct traffic across a wide area network (WAN). SD-WAN leverages network connectivity to improve application performance, accelerate productivity, and simplify network management. Typically, SD-WAN devices are usually connected to multiple network links to ensure resilience to a potential outage or degradation of service from a provider’s network. What you do have to keep in mind is that SD-WAN is not necessarily subject to compliance and service levels (SLAs).

On the other hand, MPLS, as we explained before, sends packets on predetermined network routes, avoiding connection to the public Internet and providing a greater guarantee of reliability and performance for the corporate WAN service. In addition, MPLS Service Level Agreements (SLAs) ensure a certain level of performance and uptime. Therefore, MPLS is a recommended method for organizations that need high reliability, low latency and Quality of Service (QoS) for critical applications, although its implementation cost is higher and less flexible than SD-WAN. This is because MPLS requires dedicated circuits between each location, which has its science and can take considerable time to add or remove locations from the network.

To clarify the differences, we added this table:

SD-WANMPLS

Offers a more predictable cost model with fixed pricing.

The cost is usually based on bandwidth usage.

It delivers good performance by leveraging multiple transport links and smart traffic management.

It offers increased reliability and performance, particularly for latency-sensitive applications such as VoIP and video conferencing.

It can be easily integrated with cloud-based applications and services, which can be ideal for quickly-expanding organizations or for those that have a distributed workforce.

Dedicated circuits are required between network destinations, so making changes is not as agile and can take your time and cost to make.

It offers advanced security features (example: encryption and micro-segmentation) that may enhance network security and protect against cyber threats.

It generally relies on physical security measures, such as private circuits and dedicated lines to protect network traffic.

Potentially lower reliability than MPLS, particularly for latency sensitive applications.

High reliability, especially for applications that are highly sensitive to latency and performance.

How SD-WAN and MPLS can complement each other

Now that we are clear about the difference between SD-WAN and MPLS, we must also consider that both methods do not compete with each other, but can be complemented by the following:

  • Profitability: SD-WAN can leverage lower-cost broadband Internet connections together with MPLS, reducing overall network costs while maintaining high network performance for critical applications.
  • Network Performance: MPLS provides reliable, low-latency connections for mission-critical applications, while SD-WAN can route less critical traffic over broadband or other available connections. Both methods together optimizes bandwidth usage.
  • Redundancy and reliability: Combining MPLS and SD-WAN offers greater redundancy. If an MPLS link fails, SD-WAN can automatically redirect traffic through alternate paths. This ensures steady connectivity.
  • Scalability: By means of SD-WAN, your team can simplify the onboarding of new sites and connections. With MPLS you may manage high priority traffic, leaving the rest to be managed with SD-WAN. With that, you will be implementing scalability and flexibility to adapt to business needs.
  • Security: Using SD-WAN, your IT and security employees can take advantage of the fact that it is common for it to include integrated security features (encryption and firewalls) that can complement the MPLS security strategy, as you would be adding an additional protection layer.

Also, MPLS combined with emerging technologies such as Artificial Intelligence, can offer significant improvements in network management and optimization by optimizing network traffic, detecting anomalies, automating tasks to manage networks, among others.

As you can see, your team can leverage the strengths of both methods and emerging technologies to achieve a more efficient, reliable, and cost-effective network.

How Pandora FMS monitors MPLS networks

Pandora FMS features to monitor MPLS network traffic

Pandora FMS is a flexible and scalable monitoring solution that offers multiple specific features to monitor MPLS (Multiprotocol Label Switching) networks. The main features that make this monitoring available are detailed below:

  • Bandwidth and Traffic Monitoring:
    • SNMP (Simple Network Management Protocol): Pandora FMS uses SNMP to collect real-time data on bandwidth usage and traffic from MPLS network interfaces.
    • NetFlow and sFlow: These technologies allow detailed analysis of traffic flow, identifying patterns and possible bottlenecks in the MPLS network.
  • Latency and Packet Loss Monitoring:
    • Ping and Traceroute Tests: Pandora FMS runs these tests periodically to measure latency and detect packet loss on MPLS paths.
    • Round-Trip Time Monitoring: Continuous evaluation of the time it takes for packages to travel from the source to the destination and vice versa.
  • Service Level Agreements (SLA) Management:
    • Custom Alerts: Alert configuration based on compliance with the SLAs defined for the MPLS network, ensuring that any deviation is detected and managed immediately.
    • Compliance Reports: Generation of detailed reports that show the degree of compliance with SLAs, rendering informed decision making easier.
  • Display and Dashboards:
    • Custom Dashboards: Pandora FMS allows you to create specific dashboards for MPLS networks, showing key metrics such as bandwidth usage, latency, and packet loss.
    • Interactive Network Maps: Graphic display of the MPLS network topology, facilitating quick identification of critical points and potential problems.
  • Integration with Network Management Tools:
    • APIs and Webhooks: Integration with other management and automation tools, allowing fast and coordinated responses to incidents in MPLS networks.
    • Compatibility with Security Protocols: It ensures that monitoring is performed securely, protecting sensitive data on the MPLS network.

Examples of how to ensure Quality of Service and SLA optimization

Ensuring Quality of Service (QoS) and optimizing SLAs is critical to maintain efficient and reliable MPLS networks. Pandora FMS offers several features that make this process easier:

  • Traffic Priority:
    • Traffic Classification: By using defined rules, Pandora FMS can identify and prioritize critical traffic types (such as VoIP or real-time applications) over less latency-sensitive ones.
    • Bandwidth Allocation: Dynamic adjustment of the bandwidth allocated to different types of traffic to ensure that priority applications always have the necessary resources.
  • Proactive SLA Monitoring:
    • Real-Time Alerts: Setting up alerts to notify the IT team when SLA indicators (such as availability or response time) fall below agreed levels.
    • Trend Analysis: Evaluation of history data to identify trends that may affect future SLAs, allowing for preventive adjustments in MPLS network configuration.
  • Path Optimization:
    • Traffic and Performance Analysis: By using data collected by Pandora FMS, sub-optimal paths may be identified and MPLS routing reconfigured to improve overall network performance.
    • Load Distribution: Equal distribution of traffic between different MPLS routes to avoid overloads and improve bandwidth usage efficiency.
  • SLA Detailed Reports:
    • Custom Reports: Creation of reports showing compliance with SLAs at specific intervals, providing a clear view of MPLS network performance.
    • Incident Analysis: Documentation of incidents that affected SLAs, making the identification of root causes and the implementation of corrective measures easier.

Use cases of MPLS featuring Pandora FMS

Pandora FMS (Flexible Monitoring System) can be effectively used with MPLS in multiple scenarios to improve network monitoring and management:

  • Centralized System Monitoring: Pandora FMS can monitor multiple sites connected through MPLS from a central location. That is because from devices, data can be collected automatically from remote sources (for example, Telemetry) and then transmitted to a central location (in Pandora FMS panel) where they are analyzed for system and network monitoring and control. In business ecosystems, telemetry is critical to managing and managing IT infrastructure. This configuration enables comprehensive monitoring of network performance, ensuring that all MPLS links work optimally.
  • Performance Tracking: By integrating with MPLS, Pandora FMS can track network performance metrics such as latency, jitter, and packet loss. This helps maintain Quality of Service (QoS) and ensure that critical applications receive the necessary bandwidth.
  • Fault detection and resolution: Pandora FMS detects faults in MPLS networks and generates alerts in real time. This allows your team to identify and solve issues quickly and efficiently, minimizing downtime and maintaining network reliability.
  • Traffic Analysis: With Pandora FMS, you may analyze patterns in MPLS link traffic. This helps analyze bandwidth usage, prevent bottlenecks, and optimize traffic flow.
  • Scalability: Pandora FMS, from a single console, offers the ability to monitor MPLS networks at large scale, especially for organizations with very extensive and complex network infrastructures.
  • Implementation of monitoring solutions and detection of security problems: Pandora FMS can monitor the security aspects of MPLS networks, ensuring that it remains safe and, in the event of a potential threat, issues are quickly identified and addressed.

Conclusion

Without a doubt, those in charge of networks must design a true management strategy, relying on emerging methodologies and technologies to meet the need for efficient, reliable data transmission with the lowest possible latency, while avoiding link failures, network congestion and bottleneck generation. MPLS is a methodology, that, when combined with Pandora FMS, can help your team implement mechanisms to prioritize critical traffic for high-priority applications, which demand optimal bandwidth and low latency. Additionally, the advantages of MPLS can be combined with those of SD-WAN to address potential issues more proactively and even scale flexibly to fit business needs.

That is, with Pandora FMS the three main advantages of MPLS in network monitoring are promoted:

  • Quality of Service Improvement. MPLS supports QoS mechanisms to prioritize critical traffic. Pandora FMS can identify and prioritize critical traffic types over less latency-sensitive ones. From a console, you may measure bandwidth and network consumption in real time to ensure Quality of Service.
  • SLA Compliance in Distributed Networks. Dedicated paths for data packets can be created using MPLS. This ensures that network performance metrics (latency, jitter, and packet loss) are implemented consistently. With Pandora FMS you may configure alerts to notify IT staff when any SLA indicator is below the agreed levels.
  • Bandwidth Usage Efficiency and Traffic Prioritization. Compared to traditional routing, MPLS is more efficient because it can control and prioritize routes for data packets. Pandora FMS can help you identify sub-optimal paths and reconfigure MPLS routing to improve overall network performance.

About PandoraFMS
Pandora FMS is a flexible monitoring system, capable of monitoring devices, infrastructures, applications, services and business processes.
Of course, one of the things that Pandora FMS can control is the hard disks of your computers.

About Version 2 Limited
Version 2 Digital is one of the most dynamic IT companies in Asia. The company distributes a wide range of IT products across various areas including cyber security, cloud, data protection, end points, infrastructures, system monitoring, storage, networking, business productivity and communication products.

Through an extensive network of channels, point of sales, resellers, and partnership companies, Version 2 offers quality products and services which are highly acclaimed in the market. Its customers cover a wide spectrum which include Global 1000 enterprises, regional listed companies, different vertical industries, public utilities, Government, a vast number of successful SMEs, and consumers in various Asian cities.

Pandora FMS strengthens its leadership with 136 reports recognized byG2- in the fall of 2024

Madrid, September 24, 2024 – Pandora FMS, a Spanish tech company specializing in infrastructure monitoring, has been recognized in 136 reports by G2, the world’s largest marketplace for business applications .
G2 reports reports compare products based on verified user reviews, evaluating aspects such as customer satisfaction, usability, and performance. This recognition reaffirms Pandora FMS’s position as a leader in technological monitoring, used by global companies, including all Fortune 500 companies and 60% of Forbes Cloud 100 firms.

Among Pandora FMS’s most notable accomplishments in G2 reports, the company has achieved: 

  • First place in 12 key categories:
    including the Momentum Grid® Report for Enterprise Monitoring,
    the Usability Index for Enterprise Monitoring and
    Momentum Grid® Report for Server Monitoring.

  • Second place in 18 categories:
    Mid-Market Results Index for Cloud Infrastructure Monitoring and Relationship Index for Enterprise Monitoring.
    the Relationship Index for Enterprise Monitoring.

  • Third place in 15 categories:
    as EMEA Regional Grid® Report for Server Monitoring and
    the Usability Index for Network Monitoring.

The Pandora FMS platform has received more than 190 verified reviews on G2, earning an average rating of 4.6 out of 5 stars.
Users highlight its flexibility, ease of use and ability to monitor a wide range of systems and applications in real time.
The system is especially valued for its configurability, which allows it to be adapted to specific needs in infrastructures of all types. See Pandora FMS complete profile in G2.

Kornelia Konstantinova, CMO of Pandora FMS, commented, “This recognition from G2 reflects our commitment to innovation and customer satisfaction. We have made key advances this year and will continue to deliver solutions that positively impact our customers’ technology operations.”

Among users’ opinions, features such as the ability to monitor any type of data and the possibility of supervising multiple infrastructures from a single platform, integrating the monitoring of networks, servers, applications and databases, stand out.
The ease of integration and the responsiveness of the technical support team are also positively valued.

G2’s recognition of Pandora FMS reinforces its position as a leader in the technology monitoring industry, with a consolidated presence in large and medium-sized companies globally, and continuous growth in the international market.

About PandoraFMS
Pandora FMS is a flexible monitoring system, capable of monitoring devices, infrastructures, applications, services and business processes.
Of course, one of the things that Pandora FMS can control is the hard disks of your computers.

About Version 2 Limited
Version 2 Digital is one of the most dynamic IT companies in Asia. The company distributes a wide range of IT products across various areas including cyber security, cloud, data protection, end points, infrastructures, system monitoring, storage, networking, business productivity and communication products.

Through an extensive network of channels, point of sales, resellers, and partnership companies, Version 2 offers quality products and services which are highly acclaimed in the market. Its customers cover a wide spectrum which include Global 1000 enterprises, regional listed companies, different vertical industries, public utilities, Government, a vast number of successful SMEs, and consumers in various Asian cities.

Subnets. What is a subnet? How does it work?

Subnetting is the process of dividing a network into several smaller, independent subnets. Each subnet is a portion of the core network that follows a specific logic. We know the definition of the use of subnets in local networks that we could use in our company, y, since the benefits of using subnetting are several:

  • Increase of network performance: The amount of data traffic on a network with subnets is reduced, as traffic can be directed only to the necessary subnet. This also decreases broadcast traffic (packets that are sent to all devices on the network), being able to send them only to specific subnets.
  • Improved network security: Subnets may be isolated from each other, making it easier to establish boundaries between different network segments by means of a firewall.
  • Ease of network management: Having multiple subnets increases flexibility in network management compared to working with a single network.

Process for creating subnets

Before you start creating subnets, it is important to know three key concepts:

  • Original IP Address: This is the base IP address from which you will start to create the necessary subnets. IPv4 addresses are divided into classes (A, B, C, D and E). In LAN networks, Class A (10.0.0.0 – 10.255.255.255), Class B (172.16.0.0 – 172.31.255.255), or Class C (192.168.0.0 – 192.168.255.255) addresses are generally used.
  • Subnet Mask: It indicates which part of the IP address corresponds to the network and subnet number and which part corresponds to hosts. In addition, it also tells devices to identify whether a host is within a local subnet or comes from a remote network.
  • Broadcast address: It is the highest address of a subnet and allows simultaneous traffic between all nodes of a subnet. A packet sent to the broadcast address will be sent to all subnet devices.

Once these concepts are clear, you may begin to calculate the subnets.

  • Choosing the source IP address: The choice of this source IP for a local network will usually be class A, B or C and will depend on the number of hosts you need on your network. For the example, we will use the class C address 192.168.1.0/24.
  • Determining the number of subnets: You need to decide how many subnets you wish or need to create. The more subnets, the fewer IP addresses will be available to hosts. In our example we will create 4 subnets.
  • Subnet Mask Calculation: Starting from the IP 192.168.1.0/24, where /24 indicates that we use 24 bits for the subnet, which leaves 8 bits for the hosts. This translates to binary as:
    11111111.11111111.11111111.00000000
    subnet bits (24) host bits (8)
  • Borrowing bits for subnets: To create subnets, take bits from those available for hosts. The formula to calculate how many bits you need is:
    2^n >= N
    Where N is the number of subnets (4 in our example) and n is the number of bits needed. Here, n equals 2, since: 2^2 >= 4
  • New Subnet Mask: By taking 2 bits from hosts, the new subnet mask will be:
    11111111.11111111.11111111.11000000
    subnet bits (26) / host bits (6)
    This translates to /26 or 255.255.255.192.
  • Assigning source IP addresses for each subnet: Using the two borrowed bits, you get the following combinations:
    192.168.1.0/26
    192.168.1.64/26
    192.168.1.128/26
    192.168.1.192/26
  • Calculating IPs for each subnet: For each subnet, calculate the first and last usable IP address and broadcast address:
    • Subnet 192.168.1.0/26:
      • First IP: 192.168.1.1
      • Last IP: 192.168.1.62
      • Broadcast address: 192.168.1.63
    • Subnet 192.168.1.64/26:
      • First IP: 192.168.1.65
      • Last IP: 192.168.1.126
      • Broadcast address: 192.168.1.127
    • Subnet 192.168.1.128/26:
      • First IP: 192.168.1.129
      • Last IP: 192.168.1.190
      • Broadcast address: 192.168.1.191
    • Subnet 192.168.1.192/26:
      • First IP: 192.168.1.193
      • Last IP: 192.168.1.254
      • Broadcast address: 192.168.1.255

Summarizing in a table:

SubnetFirst IPLast IPMain IPBroadcast IP
192.168.1.0/26192.168.1.1192.168.1.62192.168.1.0192.168.1.63
192.168.1.64/26192.168.1.65192.168.1.126192.168.1.64192.168.1.127
192.168.1.128/26192.168.1.129192.168.1.190192.168.1.128192.168.1.191
192.168.1.192/26192.168.1.193192.168.1.254192.168.1.192192.168.1.255

To make the task of performing these calculations easier, there are online calculators such as this one.

Subnet-to-subnet communication

Although subnets may be part of the same local network, let us not forget that now each subnet is a different network. A router is required for devices on different subnets to communicate. The router will determine whether the traffic is local or remote using the subnet mask.
Each subnet connects to a router interface, which is assigned an IP from those available for hosts. This address will be the default gateway that we will set on the computers in that subnet. All computers must have the same subnet mask (255.255.255.192 in our example).

IPv6 Subnets

Creating IPv6 subnets is different and often less complex than IPv4 ones. In IPv6 there is no need to set aside addresses for a network or broadcast address. Considering that IPv4 sets aside addresses for the main network and the broadcast address in each subnet, these two concepts do not exist in IPv6.

Creating an IPv6 Subnet

An IPv6 Unicast address has 128 bits in hexadecimal format. These 128 bits are divided into the following elements:

  • Global Routing Prefix: The first 48 bits indicate the portion of the network assigned by the service provider to a client.
  • Subnet ID: The next 16 bits after the global routing prefix are used to identify the different subnets.
  • Interface ID: The last 64 bits are the equivalent of the host bits of an IPv4 address. This allows each subnet to support up to 18 quintillion host addresses per subnet.

To create IPv6 subnets, just incrementally increase the subnet ID:
Example:

  • Global routing prefix: 2001:0db8:000b::/48
  • Subnets:
    • 2001:0db8:000b:0001::/64
    • 2001:0db8:000b:0002::/64
    • 2001:0db8:000b:0003::/64
    • 2001:0db8:000b:0004::/64
    • 2001:0db8:000b:0005::/64
    • 2001:0db8:000b:0006::/64
    • 2001:0db8:000b:0007::/64

Point-to-point networks

A point-to-point network is a particular type of network that directly communicates between two nodes, making communication between them easier, since each data channel is used to communicate only between those two devices.

Point-to-point subnets

A point-to-point subnet is a type of subnet with a /31 mask, which leaves only two addresses available to hosts. A broadcast IP is not needed in this type of configuration, as there is only communication between two computers.
These types of networks are usually used more in WAN than in LAN, and have the particularities that they are very easy to configure and at low cost, but they are not scalable nor their performance is the best, since all devices may work as client and server in a single link.

Subnet disadvantages and limitations

Although subnets provide several advantages, they also have limitations:

  • Network design complexity: The initial design and configuration may be challenging, and it is necessary to maintain a clear outline of the whole network for proper maintenance.
  • Waste of IP addresses: Each subnet needs to set aside two IPs (primary address and broadcast address) that cannot be assigned to devices. In addition, if subnets are isolated and all have the same size, unused addresses in one subnet cannot be used in another.
  • Appropriate router required: A router capable of handling the infrastructure is required, increasing complexity in routing tables.

Despite these limitations, the benefits of subnetting often outweigh the disadvantages, making it a common practice for many companies to improve the performance and security of their networks.

What do the different parts of an IP address mean?

This section focuses on IPv4 addresses, which are presented as four decimal numbers separated by periods, such as 203.0.113.112. (IPv6 addresses are longer and use letters and numbers.)
Each IP address has two parts. The first part indicates to which network the address belongs. The second part specifies the device on that network. However, the length of the “first part” changes depending on the network class.
Networks are classified into different classes, labeled A through E. Class A networks can connect millions of devices. Class B and class C networks are progressively smaller. (Class D and Class E networks are not commonly used).

Network Class Breakdown

  • Class A Network: Everything that goes before the first point indicates the network, and everything that goes after specifies the device on that network. If you use 203.0.113.112 as an example, the network is indicated with “203” and the device with “0.113.112.”
  • Class B Network: Everything that goes before the second point indicates the network. If you use 203.0.113.112 again as an example, the network is indicated with “203.0” and the device within that network with “113.112.”
  • Class C Network: In class C networks, everything that goes before the third point indicates the network. If you use the same example, “203.0.113” indicates the class C network, and “112” indicates the device.

Importance of subnets

Building IP addresses makes it relatively easy for Internet routers to find the right network to direct data to. However, on a Class A network, for example, there may be millions of devices connected, and the data may take time to find the right device. That is why subnets are useful: subnets limit the IP address for use within a range of devices.
Since an IP address is limited to indicating the network and address of the device, IP addresses cannot be used to indicate which subnet an IP packet should go to. Routers on a network use something known as a subnet mask to classify data into subnets.

What is a subnet mask?

A subnet mask is like an IP address, but only for internal use within a network. Routers use subnet masks to direct data packets to the right place. Subnet masks are not indicated within data packets traversing the Internet: those packets only indicate the destination IP address, which a router will match to a subnet.

Subnet Mask Example

Suppose an IP packet is addressed to the IP address 192.0.2.15. This IP address is a class C network, so the network is identified with “192.0.2” (or technically, 192.0.2.0/24). Network routers forward the packet to a server on the network indicated by “192.0.2.”
Once the packet reaches that network, a router on the network queries its routing table. It performs binary mathematical operations with its subnet mask of 255.255.255.0, sees the address of the device “15” (the rest of the IP address indicates the network) and calculates which subnet the packet should go to. It forwards the packet to the router or switch responsible for delivering the packets on that subnet, and the packet arrives at IP address 192.0.2.15.
In short, a subnet mask helps routers classify and route traffic efficiently within a large network, thereby improving network performance and organization.

Conclusion

Subnetting is a kay technique for dividing large networks into more manageable subnets, thereby improving network performance, security, and management. Although the process can be complex, online tools and calculators can make it significantly easier. Understanding and effectively applying subnetting is essential for any network administrator.

Market analyst and writer with +30 years in the IT market for demand generation, ranking and relationships with end customers, as well as corporate communication and industry analysis.

Analista de mercado y escritora con más de 30 años en el mercado TIC en áreas de generación de demanda, posicionamiento y relaciones con usuarios finales, así como comunicación corporativa y análisis de la industria.

Analyste du marché et écrivaine avec plus de 30 ans d’expérience dans le domaine informatique, particulièrement la demande, positionnement et relations avec les utilisateurs finaux, la communication corporative et l’anayse de l’indutrie.

About Version 2 Limited
Version 2 Digital is one of the most dynamic IT companies in Asia. The company distributes a wide range of IT products across various areas including cyber security, cloud, data protection, end points, infrastructures, system monitoring, storage, networking, business productivity and communication products.

Through an extensive network of channels, point of sales, resellers, and partnership companies, Version 2 offers quality products and services which are highly acclaimed in the market. Its customers cover a wide spectrum which include Global 1000 enterprises, regional listed companies, different vertical industries, public utilities, Government, a vast number of successful SMEs, and consumers in various Asian cities.

About PandoraFMS
Pandora FMS is a flexible monitoring system, capable of monitoring devices, infrastructures, applications, services and business processes.
Of course, one of the things that Pandora FMS can control is the hard disks of your computers.

MELT: Understanding Metrics, Events, Logs and Traces for Effective Observability

The infrastructure must be “invisible” to the user, but visible to IT strategists to ensure the performance and service levels required by the business, where observability (as part of SRE or site reliability engineering) is essential to understand the internal state of a system based on its external results. For effective observability, there are four key pillars: metrics, events, logs, and traces, which are summarized in the acronym MELT 

Next, define each of these pillars.


Metrics

What are Metrics?

They are numerical measures, usually periodic, that provide information about the state of a system and performance.

Examples of useful metrics

Response times, error rates, CPU usage, memory consumption, and network performance.

Advantages of using metrics

Metrics allow IT and security teams to track key performance indicators (KPIs) to detect trends or anomalies in system performance.

Events

What are Events?

They are discrete events or facts within a system, which can range from the creation of a module to the login of a user in the console. The event describes the problem, source (agent), and creation.

Event examples in systems

User actions (user login attempts), HTTP responses, changes in system status, or other notable incidents.

How events provide context

Events are often captured as structured data, including attributes such as timestamp, event type, and associated metadata, providing greater elements and information to the IT team to understand system performance and detect patterns or anomalies.

Logs

What are logs?

They are detailed records of events and actions that take place in a system. Also these collected data provide a chronological view of system activity, offering more elements for troubleshooting and debugging, understanding user behavior, and tracking system changes. Logs can contain information such as error messages, stack traces, user interactions, notifications about system changes.

Common log formats

Usually, logs use plain format files, either in ASCII type character encodings or stored in text form. The best known formats are Microsoft IIS3.0, NCSA, O’Reilly or W3SVC. In addition, there are special formats such as ELF (Extended Log Format) and CLF (Common Log Format).

Importance of centralizing logs

Log centralization ensures a complete and more contextualized system view at any time. This allows you to proactively spot problems and potential problems, as well as take action before they become bigger problems. Also this centralization allows to have the essential elements for audits and regulatory compliance, since compliance with policies and regulations on safety can be demonstrated.

Traces

What are Traces?

Traces provide a detailed view of the request flow through a distributed system. This is because they capture the path of a request as it goes through multiple services or components, including the time at each step. That way, traces help to understand dependencies and potential performance bottlenecks, especially in a complex system. Also traces allow to analyze how system architecture can be optimized to improve overall performance and, consequently, the end user experience.

Examples of traces in distributed systems

  • The interval or span is a timed, named operation that represents a portion of the workflow. For example, intervals may include data queries, browser interactions, calls to other services, etc.
  • Transactions may consist of multiple ranges and represent a complete end-to-end request that travels across multiple services in a distributed system.
  • The unique identifiers for each, in order to track the path of the request through different services. This helps visualize and analyze the path and duration of the request.
  • Spreading trace context involves passing trace context between services.
  • Trace display to show the request flow through the system, which helps identify failures or performance bottlenecks.

Also, traces provide detailed data for developers to perform root cause analysis and with that information address issues related to latency, errors, and dependencies.

Challenges in trace instrumentation

Trace instrumentation can be difficult basically because of two factors:

  • Each component of a request must be modified to transmit trace data.
  • Many applications rely on libraries or frameworks that use open source, so they may require additional instrumentation.

Implementing MELT in Distributed Systems

Adopting observability through MELT involves Telemetry; that is, automatic data collection and transmission from remote sources to a centralized location for monitoring and analysis. From the data collected, the principles of telemetry (analyze, visualize and alert) must be applied to build resilient and reliable systems.

Telemetry Data Collection

Data is the basis of MELT, in which there are three fundamental principles of telemetry:

  • Analyzing the collected data allows obtaining important information, relying on statistical techniques, machine learning algorithms and data mining methods to identify patterns, anomalies and correlations. By analyzing metrics, events, logs, and traces, IT teams can uncover performance issues, detect security threats, and understand system performance.
  • Viewing data makes it accessible and understandable to stakeholders. Effective visualization techniques are the dashboards, charts, and graphs that represent the data clearly and concisely. In a single view, you and your team can monitor system health, identify trends, and communicate findings effectively.
  • Alerting is a critical aspect of observability. When alerts are set up based on predefined thresholds or anomaly detection algorithms, IT teams can proactively identify and respond to issues. Alerts can be triggered based on metrics that exceed certain limits, events that indicate system failures, or specific patterns in logs or traces.

Aggregate Data Management

Implementing MELT involves handling a large amount of data from different sources such as application logs, system logs, network traffic, services and third-party infrastructure. All of this data should be found in a single place and aggregated in the most simplified form to observe system performance, detect irregularities and their source, as well as recognize potential problems. Hence, aggregate data management based on a defined organization, storage capacity, and adequate analysis is required to obtain valuable insights.
Aggregating data is particularly useful for logs, which make up the bulk of the telemetry data collected. Logs can also be aggregated with other data sources to provide supplemental insights into application performance and user behavior.

Importance of MELT in observability

MELT offers a comprehensive approach to observability, with insights into system health, performance, and behavior, from which IT teams can efficiently detect, diagnose, and solve issues.

System Reliability and Performance Improvements

Embracing observability supports the goals of SRE:

  • Reduce the work associated with incident management, particularly around cause analysis, by improving uptime and Mean Time To Repair (MTTR).
  • Provide a platform to monitor and adapt according to goals in service levels or service level contracts and their indicators (see What are SLAs, SLOs, and SLIs?). It also provides the elements for a possible solution when goals are not met.
  • Ease the burden on the IT team when dealing with large amounts of data, reducing exhaustion or overalerting. This also leads to boosting productivity, innovation and value delivery.
  • Support cross-functional and autonomous computers. Better collaboration with DevOps teams is achieved.

Creating an observability culture

Metrics are the starting point for observability, so a culture of observability must be created where proper collection and analysis are the basis for informed and careful decision-making, in addition to providing the elements to anticipate events and even plan the capacity of the infrastructure that supports the digitization of the business and the best experience of end users.

Tools and techniques for implementing MELT

  • Application Performance Monitoring (APM): APM is used to monitor, detect, and diagnose performance problems in distributed systems. It provides system-wide visibility by collecting data from all applications and charting data flows between components.
  • Analysis AIOps: These are tools that use artificial intelligence and ML to optimize system performance and recognize potential problems.
  • Automated Root Cause Analysis: AI automatically identifies the root cause of a problem, helping to quickly detect and address potential problems and optimize system performance.

Benefits of Implementing MELT

System reliability and performance requires observability, which must be based on the implementation of MELT, with data on metrics, events, logs, and traces. All of this information must be analyzed and actionable to proactively address issues, optimize performance, and achieve a satisfactory experience for users and end customers.

Pandora FMS: A Comprehensive Solution for MELT

Pandora FMS is the complete monitoring solution for full observability, as its platform allows data to be centralized to obtain an integrated and contextualized view, with information to analyze large volumes of data from multiple sources. In a single view, it is possible to see the status and trends in system performance, in addition to generating smart alerts efficiently. It also generates information that can be shared with customers or suppliers to meet the standards and goals of services and system performance. To implement MELT:

  • Pandora FMS unifies https://pandorafms.com/en/it-topics/it-system-monitoring/ regardless of the operating model and infrastructures (physical or SaaS, PaaS or IaaS).
  • With Pandora FMS, you may collect and store all kinds of logs (including Windows events) to be able to search and configure alerts. Logs are stored in non-SQL storage that allows you to keep data from multiple sources for quite some time, supporting compliance and audit efforts. Expanding on this topic, we invite you to read the Infrastructure Logs document, the key to solving new compliance, security and business related questions.
  • Pandora FMS offers custom dashboard layouts to display real-time data and multi-year history data. Reports on availability calculations, SLA reports (monthly, weekly or daily), histograms, graphs, capacity planning reports, event reports, inventories and component configuration, among others, can be predefined.
  • With Pandora FMS, you may monitor traffic in real time, getting a clear view of the volume of requests and transactions. This tool allows you to identify usage patterns, detect unexpected spikes, and plan capacity effectively.
  • With the premise that it is much more effective to visually show the source of a failure than simply receiving hundreds of events per second. Pandora FMS offers the value of its service monitoring, which allows you to filter all information and show only what is critical for making appropriate decisions.

Market analyst and writer with +30 years in the IT market for demand generation, ranking and relationships with end customers, as well as corporate communication and industry analysis.

Analista de mercado y escritora con más de 30 años en el mercado TIC en áreas de generación de demanda, posicionamiento y relaciones con usuarios finales, así como comunicación corporativa y análisis de la industria.

Analyste du marché et écrivaine avec plus de 30 ans d’expérience dans le domaine informatique, particulièrement la demande, positionnement et relations avec les utilisateurs finaux, la communication corporative et l’anayse de l’indutrie.

About Version 2 Limited
Version 2 Digital is one of the most dynamic IT companies in Asia. The company distributes a wide range of IT products across various areas including cyber security, cloud, data protection, end points, infrastructures, system monitoring, storage, networking, business productivity and communication products.

Through an extensive network of channels, point of sales, resellers, and partnership companies, Version 2 offers quality products and services which are highly acclaimed in the market. Its customers cover a wide spectrum which include Global 1000 enterprises, regional listed companies, different vertical industries, public utilities, Government, a vast number of successful SMEs, and consumers in various Asian cities.

About PandoraFMS
Pandora FMS is a flexible monitoring system, capable of monitoring devices, infrastructures, applications, services and business processes.
Of course, one of the things that Pandora FMS can control is the hard disks of your computers.

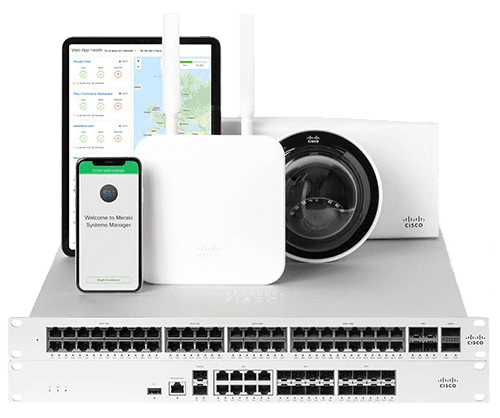
Cisco Meraki Monitoring with Pandora FMS

In a business world increasingly oriented towards efficiency and mobility, network management becomes a critical factor for success. Cisco Meraki stands as an undisputed leader thanks to its ability to offer a fully cloud-based technology, allowing companies of any size to manage their network devices remotely and centrally. This platform not only ensures the security and scalability required in enterprise environments, but also optimizes network performance by adapting the available bandwidth to the demands of the devices. However, to take full advantage of Cisco Meraki and ensure optimal infrastructure performance, proper monitoring becomes essential. In this context, Pandora FMS emerges as an end-to-end solution that allows adding a customized monitoring layer to the Cisco Meraki platform, facilitating early problem detection, performance analysis and scalability planning. Next, we will explore in detail why the combination of Cisco Meraki and Pandora FMS is the ideal choice for companies looking for efficient and proactive management of their network.

LThe great advantage of Cisco Meraki, which has made it stand out as a leader in its sector, is that it allows companies, regardless of the size of their network infrastructure, to offer 100% cloud-based technology.
Of course, this allows you to manage devices from multiple locations remotely through a centralized tool, which has an API through which you may query through Pandora FMS, to add the whole monitoring of the environment in an easily and quickly, through plugins already designed for this function.

Why to Choose Cisco Meraki?

It is worth mentioning that the great advantage of Cisco Meraki is the technology of its cloud-based platform, which is widespread among companies of all sizes, and which includes the following advantages:

  • Security: It offers malware protection, state-of-the-art firewalls, and data encryption. The standards comply with PCI level 1 regulations.
  • Scalability: Cisco Meraki integration can be done both for one site and for thousands of devices distributed at different points. In addition, once deployed from the beginning, tools are offered to make the growth of the environment as efficient as possible.
  • Performance: It provides network administrators with optimal performance by adapting the available bandwidth to the devices available.

Why monitor Cisco Meraki?

  • Network Troubleshooting: It includes equipment malfunction or network overflow through traffic analysis tools.
  • Environment Performance Analysis: Equipment that appears to be working properly but is actually flapping at its ports or a network interface whose speed is not enough to meet bandwidth needs can be as disruptive to your infrastructure as a device that is downright down.
  • Infrastructure Scalability Scheduling: Are you sure that your devices are enough to meet the needs of your network? Monitoring the environment is key both to find out if it is necessary to add more devices, and to know whether there are lots of them for your real traffic.

Why choose Pandora FMS to monitor Cisco Meraki?

Let’s face it, Meraki’s own Cloud already includes infrastructure monitoring tools such as dashboards. So why should you worry about monitoring your Cloud devices with external software like Pandora FMS?
Here are just a few of the advantages you would enjoy by adding Cloud devices to Pandora FMS:

  • Fully Custom Alerting Settings: Defining an alert when a problem is detected in a sensor (module) in Pandora FMS goes beyond notifying you by email or other notification tools, such as SMS or Telegram, the number of times and in the period of time you need. This section also includes the possibility of performing custom actions, such as trying to reboot a device automatically, writing on log files, opening an incident ticket on a ticketing platform…
  • Custom Infrastructure Definition: Differentiating between groups of agents, agents and modules is fully definable depending on how you want to define computer division in your infrastructure.
  • Stored Event History: Any status change and alert triggering from your sensors generates an event that is stored in a history that can be checked to perform a problem analysis in your network.
  • Creating custom services, reports and visual consoles: Pandora FMS services allow you to assign importance to the different computers through a weighting system, visual consoles allow you to build your whole network infrastructure through icons that may change color according to device status in real time. Reports can be configured to prepare a summary of availability of a equipment or a network interface in an estimated time… these are just some examples of the analysis that you may get by storing your device data in Pandora FMS.
  • Ease of integration between platforms: We have a plugin with which to add the devices within the Meraki Cloud with a simple execution. It is also possible to customize the modules you wish to add if you have direct access to the equipment using the SNMP protocol.

Pandora FMS Modules for Cisco Meraki

A Pandora FMS module is an information entity that stores data from a numeric or alphanumeric individual check (CPU. RAM, traffic, etc.). That is, if in a switch you wish to monitor its general CPU, and the operating state and input and output traffic of two of its interfaces, you will need to create 7 modules: one for the general CPU, two for the operating state of the two interfaces, two for the input traffic of the two interfaces and two for the output traffic of the two interfaces.
Modules are stored in dummy entities called agents. Generally, each agent represents a different device.
Finally, an agent always belongs to a group. Groups are sets that contain agents and are used to filter and control visibility and permissions.
By knowing these terms, we can get to know the structure of devices and checks that are automatically created in Pandora FMS with the execution of the “pandora_meraki” plugin that we have to add to our monitoring the information that can be retrieved from the cloud.

Meraki device agents and modules created using plugins

We have an official PandoraFMS plugin that will hugely improve the task of adding devices from the Meraki Cloud to your monitoring.
The plugin documentation can be found at the following link.
It is a server plugin (it must be located on the machine where PandoraFMS server is located), which must be indicated through parameters the URL of your Cloud, the organization ID of the company and the name of the group to add the agents that will be created through the plugin. With a simple execution, agents will be created for each appliance, switch and wireless device within a Network that matches the name of the group indicated by the parameter.
The modules created will be the following:

  • For each appliance device:
    • Device status
    • Operational status of its interfaces
    • Performance percentage
  • For each switch device:
    • Device status
    • Operational status of its enabled interfaces
    • Inbound traffic from its enabled interfaces
    • Outbound traffic from its enabled interfaces
  • For each wireless device:
    • Device status


Meraki device agents and modules created through SNMP checks

If it is necessary to add an extra module to those created by the plugin and there is connectivity between Pandora FMS server and the Meraki network devices, it is also possible to add monitoring through SNMP check polling network modules.
SNMP version 1, 2 or 3 protocol must be activated in the configuration of the Meraki devices and a network server module must be created for each check that is needed, as in any other network device.
This video explains how to create these types of modules.

Conclusions

Delving into more extensive monitoring than that offered by Meraki’s own Cloud-native systems is necessary to detect medium/long-term problems such as network saturation and perform a performance and scalability analysis. And it is downright essential for the configuration of a custom and immediate alert and the automation of tasks such as ticket creation.
To delve into it, it is necessary to have a system specifically oriented to monitoring and that offers the integration of this system with the devices added to the Cloud.
Pandora FMS allows, not only all this ease of integration and analysis tools for the Meraki Cloud, but also in the same environment it is possible to add the whole monitoring of the rest of the company’s areas and devices, such as servers, or the addition of metrics from other manufacturers.

About Version 2 Limited
Version 2 Digital is one of the most dynamic IT companies in Asia. The company distributes a wide range of IT products across various areas including cyber security, cloud, data protection, end points, infrastructures, system monitoring, storage, networking, business productivity and communication products.

Through an extensive network of channels, point of sales, resellers, and partnership companies, Version 2 offers quality products and services which are highly acclaimed in the market. Its customers cover a wide spectrum which include Global 1000 enterprises, regional listed companies, different vertical industries, public utilities, Government, a vast number of successful SMEs, and consumers in various Asian cities.

About PandoraFMS
Pandora FMS is a flexible monitoring system, capable of monitoring devices, infrastructures, applications, services and business processes.
Of course, one of the things that Pandora FMS can control is the hard disks of your computers.

Distributed Systems Monitoring: the Four Golden Signals

What are the Four Golden Signs?

We recently published the IT Topic “IT System Monitoring: advanced solutions for total visibility and security”, in which we present how advanced solutions for IT system monitoring optimize performance, improve security and reduce alert noise with AI and machine learning. We also mentioned that there are four golden signals that IT systems monitoring should focus on. The term “golden signals” was introduced by Google in 2014 in its book Site Reliability Engineering: How Google Runs Production Systems,where Site Reliability Engineering (SRE) is a discipline used by IT and software engineering teams to proactively create and maintain more reliable services. The four golden signs are also defined:

  • Latency: This metric is the time that elapses between a system receiving a request and subsequently sending a response. You might think of it as a unique “average” latency metric, or perhaps an established “average” latency that can be used to guide SLAs. But, as a golden signal we want to observe the latency over a period of time, which can be displayed as a histogram of frequency distribution. For instance:

    This histogram shows the latency of 1000 requests made to a service with an expected response time of less than 80 milliseconds (ms). Each histogram section groups requests according to the amount of time they take to complete, from 0 ms to 150 ms in increments of five.
  • Traffic: It refers to the demand in the system. For example, a system might have an average of 100 requests HTTPS per second; but averages can be misleading. Average trends can be observed for problems or averages over time. Also, traffic may increase at certain times of the day (when people respond to an offer for a few hours or inquiries are made about stock prices at market close.
  • Errors: It refers to API error codes that indicate something is not working properly. The tracking of the total number of errors that take place and the percentage of failed requests allows you to compare the service with others. Google SREs extend this concept to include functional errors of incorrect data and slow responses.
  • Saturation: There is a saturation point for networks, disks, and memory where demand exceeds the performance limits of a service. You can do load testing to identify the saturation point, as well as restrictions, when a request failed first. A very common bad practice is to ignore saturation when there are load balancers and other automated scaling mechanisms. In poorly configured systems, inconsistent scaling and other factors can prevent load balancers from doing their job properly. For that reason, monitoring saturation helps teams identify issues before they become serious problems by taking proactive actions to prevent these incidents from happening again.

The Importance of the Four Golden Signals in Monitoring

The relevance of the four golden signals in IT systems monitoring lies in the feasible tracking on latency, traffic, errors and saturation of all services, in real time, providing the elements for IT teams to identify potential or ongoing issues more quickly. Also, with the single view of everyone’s status, the work of the team devoted to monitoring IT or third-party systems is streamlined. Instead of performing different monitoring for each function or service, monitoring metrics and records can be grouped into a single location. All of this helps to better manage issues and track the whole lifecycle of an event.

How to Implement the Four Golden Signals

The four golden signals are a way to help SRE teams focus on what’s important, so they don’t rely on a plethora of metrics and alarms that might be difficult to interpret. To implement them, follow these steps:

  • Define baselines and thresholds: Sets normal operating ranges or service level targets for each signal. SLO help identify anomalies and set up significant alerts. For example, you may set a latency threshold of 200 ms; if it is higher, an alert should be triggered.
  • Implement alerts: Set up alerts to receive notifications when signals exceed predefined thresholds, ensuring issues can be responded to promptly. Combination with AI streamlines alert and notification management and escalation.
  • Analyze trends: Review historical data periodically to understand trends and patterns, as well as gather information for proactive capacity planning and identifying areas of opportunity to optimize them. Advanced analytics and AI are valuable tools to give the correct reading to these analyses.
  • Automate responses: Try to automate responses to common problems so as not to overwhelm your IT team and so that they can also focus on more strategic tasks or incidents that really deserve attention. With AI, automatic scaling can be established to help manage traffic spikes.

Monitoring Tools Open Source or Commercial Solutions?

To choose a Monitoring tool, the question may arise as to which option is more convenient: an open source one or a commercial solution. The answer should not depend only on an economic question (whether or not to pay for resources), but also on taking into account that almost all IT products cannot do without open source, since they are constantly used and that is why we do not question their value. Of course, it should be borne in mind that, to use open source, you must choose monitoring solutions supported by professional and reliable monitoring, in addition to support for correct configuration.
It is also important for the open source solution to be intuitive, to not represent a consumption of valuable time spent on configuration, adjustments, maintenance and updating tasks. Remember that agility and speed are required.

Importance of Golden Signals in Observability

Monitoring allows problems to be detected before they become critical, while observability is particularly useful for diagnosing problems and understanding the root cause. Golden signals enable site reliability engineering (SRE) to be implemented based on availability, performance, monitoring, and readiness to respond to incidents, improving overall system reliability and performance. Also, monitoring based on golden signals offers the observability elements to find out what is happening and what needs to be done about it. To achieve observability, metrics from different domains and environments must be gathered in one place, and then analyzed, compared, and interpreted.

The Golden Signals as Part of Full-Stack Observability

The full-stack observability refers to the ability to understand what is happening in a system at any time, monitoring system inputs and outputs, along with cross-domain correlations and dependency mapping. Golden signals help manage the complexities of multi-component monitoring, avoiding blind spots. It also links system behavior, performance, and health to user experience and business outcomes.
Also, golden signals are integrated to the principles of SRE: Risk Acceptance, Service Level Objectives, Automation, Effort Reduction, and Distributed Systems Monitoring, combining software engineering and operations to build and execute large-scale, distributed, and high-availability systems. SRE practices also include the definition and measurement of reliability objectives, the design and implementation of observability, along with the definition, testing and execution of incident management processes. In advanced observability platforms, the golden signals provide the data to also improve financial management (costs, capital decisions by use of technologies, SLA compliance), security and risk prevention.

Conclusion

The digital nature of business has caused IT security strategists to face the complexity of multi-component monitoring. Golden signals provide the key indicators that apply to almost all types of systems. In addition, it is necessary to analyze and predict system performance, where observability is essential. In this regard, MELT (Metrics, Events, Logs, and Traces) is a framework with a comprehensive approach to observability, gaining insight into the health, performance, and performance of systems.

Pandora FMS: a Complete Solution for Monitoring the Four Golden Signals

Pandora FMS stands out as a complete solution for monitoring distributed systems and implementing the Four Golden Signals. Here we explain why.

1. Versatility and Flexibility
Pandora FMS (Flexible Monitoring System) is known for its ability to adapt to different environments and business needs. Whether you’re managing a small on-premise infrastructure or a complex, large-scale distributed system, Pandora FMS can scale and adapt seamlessly.

2. Comprehensive Latency Monitoring
Pandora FMS enables detailed latency monitoring at different levels, from application latency to network and database latency. It provides real-time alerts and intuitive dashboards that make it easy to identify bottlenecks and optimize performance.

3. Detailed Traffic Monitoring
With Pandora FMS, you may monitor traffic in real time, getting a clear view of the volume of requests and transactions. This tool allows you to identify usage patterns, detect unexpected spikes, and plan capacity effectively.

4. Error Detection and Analysis
Pandora FMS platform offers a strong feature for error detection, both application errors, network errors, such as packet loss, network interface errors and device errors through SNMP traps in real time or even failures in the infrastructure. Configurable alerts and detailed reports help teams respond quickly to critical issues, reducing downtime and improving system reliability.

5. Resource Saturation Monitoring
Pandora FMS monitors key resource usage, such as CPU, memory, and storage, allowing administrators to anticipate and avoid saturation. This is vital to keep system performance and availability under control, especially during periods of high demand.

6. Integration with Existing Tools and Technologies
Pandora FMS integrates easily with a wide range of existing tools and technologies, enabling easier deployment and greater interoperability. This flexibility makes it easy to consolidate all monitoring data into a centralized platform.

7. Custom Reports and Intuitive Dashboards
The ability to generate custom reports and interactive dashboards allows IT teams to look at the status of their systems effectively. These features are essential for informed decision making and continuous service improvement.

8. Support and Active Community
Pandora FMS has strong technical support and an active community that offers ongoing resources and support. This is crucial to ensure that any issues are quickly solved and that users can get the most out of the platform.

9. Cost-Effectiveness
Unlike many commercial solutions, Pandora FMS offers excellent value for money, providing advanced features at a competitive cost. This makes it an attractive option for both small businesses and large corporations.

About Version 2 Limited
Version 2 Digital is one of the most dynamic IT companies in Asia. The company distributes a wide range of IT products across various areas including cyber security, cloud, data protection, end points, infrastructures, system monitoring, storage, networking, business productivity and communication products.

Through an extensive network of channels, point of sales, resellers, and partnership companies, Version 2 offers quality products and services which are highly acclaimed in the market. Its customers cover a wide spectrum which include Global 1000 enterprises, regional listed companies, different vertical industries, public utilities, Government, a vast number of successful SMEs, and consumers in various Asian cities.

About PandoraFMS
Pandora FMS is a flexible monitoring system, capable of monitoring devices, infrastructures, applications, services and business processes.
Of course, one of the things that Pandora FMS can control is the hard disks of your computers.

What are SLA, SLO, and SLI?

Learn the differences between SLA, SLO and SLI and how to implement these metrics to improve the quality of service offered by your company. Also, learn about the challenges and best practices for implementing them, along with some real-world examples.

Importance of SLA, SLO and SLI in user experience

Talking about SLA, SLO and SLI means talking about user experience. Each of these acronyms (we will explain them later) is on the minds of developers, who are looking to achieve increasingly reliable and high-quality IT services and resources. To achieve this, they must understand and effectively manage objectives at service levels, relying on defined indicators and formal agreements that lead them to achieve user satisfaction.

Objective of metrics and their application in system performance

What is measured can be improved… so metrics help ensure a service meets its performance and reliability goals. They also help align the goals of different teams within an organization toward one goal: the best user experience.

Differences between SLA, SLO and SLI

  • Definition and scope of each metric.
    Imagine a base where SLI (Service Level Indicators) refers to the quantifiable measurement to evaluate the performance of a service. Above this base you may find SLO (Service Level Objectives), which set objectives for service performance, and SLA (Service Level Agreement), which are legally binding contracts between a service provider and a customer.
  • Example and applications in different contexts.
    For example, a cloud service provider may define latency as the amount of time it takes to process a user’s request and return a response as SLI. From there, an SLO of no more than 100 milliseconds is established for a consecutive period of 30 days; if the average latency exceeds this value, they will issue service credits to customers.
    If an SLI is set on the e-commerce website based on the error rate as a percentage of failed transactions, the SLO could set the error rate to not exceed 0.5% during any 24-hour period. The SLA agreed with the cloud service provider would include this SLO, along with penalties or compensation if it is not met.

SLI: Service Level Indicator

Meaning and function

Service Level Indicators (SLIs) measure the performance and reliability of a service, to determine whether an offer meets its quality objectives. The SLI also helps identify areas for improvement. Examples of indicators include latency (response time), error rate, throughput, and availability (uptime). These metrics are usually monitored over specific time periods to assess performance. As it can be seen, SLIs are the foundation for setting performance and reliability benchmarks for a service.

Challenges and strategies for their measurement

Based on the fact that SLI refers to metrics, the main challenge is to achieve a simple approach to the indicators, since they must be easily analyzed and compared in order to speed up decision-making based on the results. Another challenge is choosing useful tracking metrics that correspond to the actual needs of the product or service.

SLO: Service Level Objective

Definition and purpose

Service Level Objectives (SLOs) set performance and reliability objectives that service providers aim to achieve, in line with a service’s SLIs. So these SLO help to evaluate and monitor whether the service meets the desired quality level. For example, a cloud provider may say that their goal is to achieve 99.99% availability over a specific time period.

Challenges and recommendations for implementation

The main challenge is that objectives must be clear, specific and measurable, so it is recommended that the service provider works closely with stakeholders to define SLOs and their scopes.

SLA: Service Level Agreement

Concept and purpose

A service level agreement (SLA) is a legally binding contract between a service provider and a customer, outlining agreed SLOs and penalties for non-compliance. SLAs ensure that providers and stakeholders clearly understand the expectations about the quality of service and the repercussions in case of non-compliance (financial compensation or service credits) with the agreed standards. SLAs include SLOs such as latency times, error rate, and availability. Of course, before service begins, the service provider and the customer will negotiate Service Level Agreements. SLAs help to have a clear understanding of performance expectations, channels and courses of action, and service reliability, safeguarding the interests of both parties.

Challenges and best practices

One of the most important challenges of an SLA is that it does not go along the line of business priorities, so a best practice is to involve the business areas where the greatest impact on the service level is generated in the agreements. Also, monitoring the SLA and updating them can be a complex process that requires reports with data obtained from multiple sources of information. In this regard, it is recommended to acquire the technological tools that help to retrieve data from multiple sources in a more agile and automated way.

Comparison between SLA, SLO and SLI

As we have seen, SLIs are the foundation for SLOs and SLAs, with quantitative metrics to assess service performance and reliability. SLOs use data derived from SLIs to set specific objectives on service performance, ensuring that the service provider and stakeholders have clear objectives to achieve. Hence, SLAs incorporate SLOs into a contract between the service provider and the customer, so that both parties have a clear understanding of performance expectations and consequences in the event of non-compliance.
To be clearer, it helps to look at these tables that compare differences, challenges, and best practices:

Table 1: Differences between SLA, SLO and SLI

Metric

Purpose

Application

Flexibility

SLI

Actual measurement of service performance.

Internal, paid.
(actual number on performance)

High flexibility.

SLO

Internal objectives that indicate service performance.

Internal and external, free and paid.
(objectives of the internal team to comply with the service level agreement)

Moderate flexibility.

SLA

Agreement with customers on service commitments.

Payments, availability.
(the agreement between the provider and the service user)

Low flexibility.

As it can be seen in Table 1, to the extent that the metric is more specific (SLI), there is greater flexibility for its definition, AND, the more specific the metric (SLA), the more parties involved the commitment is.

Table 2: Challenges and best practices

Metric

Challenges

Best Practices

SLI

Definition of product or service associated with business needs.
Accurate and consistent measurement.

Another challenge is choosing useful tracking metrics that correspond to the actual needs of the product or service.
Track system evolution and visualize data.

SLO

Balance between complexity and simplicity.
Define the objectives must be clear, specific and measurable.

Close collaboration with the parties involved in the service to define SLOs and their scopes.
Continuously improve and select valuable metrics.

SLA

Alignment with business objectives.
Collaboration between legal and technical teams.
Retrieving data from multiple sources to measure compliance levels.

Define realistic expectations, with a clear understanding of the impact on the business.
Reach consensus with stakeholders and the technical team to define the agreements in the SLA.
Use technological tools that help to retrieve data from multiple sources in a more agile and automated way.

In Table 2, you may see that the challenges for the metric are different, due to their internal or external nature. For example, SLOs are internal objectives of the service provider, while SLAs establish a commitment between the provider and the customer (service user), as well as penalties in case of non-compliance.

Real-world applications

Examples of how these metrics are applied in different companies and services.

  • SLI:
    • Service availability/uptime.
    • Number of successful transactions/service requests.
    • Data consistency.
  • SLO:
    • Disk life must be 99.9%
    • Service availability must be 99.5%
    • Requests/transactions successfully served must reach 99.999%
  • SLA:
    • Agreement with clauses and declarations of the signing parties (supplier and user), validity of the agreement, description of services and their corresponding metrics, contact details and hours for support and escalation courses, sanctions and causes of termination in case of non-compliance, termination clauses, among others.

Conclusion

Service metrics are essential to ensure the quality of the service offered. Whether you are working with the service provider or you are on the other side of the desk, the service user, you need to have reliable and clear information about a service’s performance in order to generate better user experiences, which in turn translates into better responsiveness to internal customers (including vendors and business partners) and external customers of any organization. Additionally, do not overlook the fact that more and more companies are adopting outsourcing services, so it is helpful to be familiar with these terms, their applicability and best practices.

We also recommend these tools that Pandora FMS puts at your disposal:

Olivia Diaz

Market analyst and writer with +30 years in the IT market for demand generation, ranking and relationships with end customers, as well as corporate communication and industry analysis.

Analista de mercado y escritora con más de 30 años en el mercado TIC en áreas de generación de demanda, posicionamiento y relaciones con usuarios finales, así como comunicación corporativa y análisis de la industria.

Analyste du marché et écrivaine avec plus de 30 ans d’expérience dans le domaine informatique, particulièrement la demande, positionnement et relations avec les utilisateurs finaux, la communication corporative et l’anayse de l’indutrie.

About Version 2 Limited
Version 2 Digital is one of the most dynamic IT companies in Asia. The company distributes a wide range of IT products across various areas including cyber security, cloud, data protection, end points, infrastructures, system monitoring, storage, networking, business productivity and communication products.

Through an extensive network of channels, point of sales, resellers, and partnership companies, Version 2 offers quality products and services which are highly acclaimed in the market. Its customers cover a wide spectrum which include Global 1000 enterprises, regional listed companies, different vertical industries, public utilities, Government, a vast number of successful SMEs, and consumers in various Asian cities.

About PandoraFMS
Pandora FMS is a flexible monitoring system, capable of monitoring devices, infrastructures, applications, services and business processes.
Of course, one of the things that Pandora FMS can control is the hard disks of your computers.

eHorus and Integria IMS are now Pandora RC and Pandora ITSM

 Pandora FMS announces brand unification with Pandora ITSM and Pandora RC 

Pandora FMS, a leader in the Information Technology and Monitoring solutions market, is glad to announce that the unification of its brands, Integria IMS and eHorus, under the new names Pandora ITSM and Pandora RC, respectively, has been successfully implemented.

Pandora ITSM, formerly known as Integria IMS, represents Pandora FMS IT Service Desk and Service Management solution. It provides a comprehensive platform for managing IT incidents, issues, changes and assets, enabling organizations to improve the efficiency of their IT departments and deliver a superior service to end users.

Pandora RC, formerly known as eHorus, is the Remote Control solution from Pandora FMS. It offers a safe and effective platform to access and manage servers and devices remotely from any location in the world. Pandora RC becomes an essential tool for system administrators and support technicians looking to maintain the effective operation of their systems.

This significant advance reflects Pandora FMS’ commitment to further strengthen and consolidate its position in the technology solutions market, providing a more comprehensive and cohesive service and strategy for both its customers and partners.


Such brand unification will be completed across all Pandora FMS platforms, website and social media.

We would also like to underline that eHorus and Integria have always been part of Pandora FMS family, and this change does not alter our dedication to providing exceptional IT monitoring and management solutions.

“We are excited to see how Pandora ITSM and Pandora RC brand and products are further integrated into Pandora FMS. Pandora ITSM has always represented a compelling mission and value proposition in the field of IT service management“, – Sancho Lerena CEO of Pandora FMS. 

“For a long time, IT service monitoring, IT service management (ITSM), and remote control solutions have evolved independently, but now, under the Pandora FMS umbrella, we are exceptionally unifying these three areas.”

This brand unification reflects the trend in the technology industry towards the consolidation and simplification of product and service offerings, with the aim of improving the customer experience. Pandora ITSM and Pandora RC celebrate this achievement and are committed to continuing to excel in their respective fields.

We are committed to your satisfaction and look forward to exceeding your expectations in the future.

About Version 2 Limited
Version 2 Digital is one of the most dynamic IT companies in Asia. The company distributes a wide range of IT products across various areas including cyber security, cloud, data protection, end points, infrastructures, system monitoring, storage, networking, business productivity and communication products.

Through an extensive network of channels, point of sales, resellers, and partnership companies, Version 2 offers quality products and services which are highly acclaimed in the market. Its customers cover a wide spectrum which include Global 1000 enterprises, regional listed companies, different vertical industries, public utilities, Government, a vast number of successful SMEs, and consumers in various Asian cities.

About PandoraFMS
Pandora FMS is a flexible monitoring system, capable of monitoring devices, infrastructures, applications, services and business processes.
Of course, one of the things that Pandora FMS can control is the hard disks of your computers.

Why business continuity belongs in the cloud?

Resilience in today’s liquid business environment demands flexibility. The term “observability” replaces monitoring, reflecting the need to adapt and be agile in the face of challenges. The key is to dissolve operations into the cloud, integrating tools and operational expertise for effective resilience.

I remember that when I started my professional career (in a bank) one of the first tasks I was handled was to secure an email server exposed to the internet. Conversations around coffee were about these new trends that seemed suicidal, they wanted to take away service exploitation to servers on the internet!

There wasn’t even talk of the cloud at that time. The first steps of software as a service were already being taken, but in short, everything was on-premise, and infrastructure was the queen of computing, because without a data center, there was no business.

Two decades have gone by and the same thing that happened to Mainframes has happened to data centers. They are reminiscences of the past, something necessary, but outside of our lives. No one builds business continuity around the concept of the data center anymore, who cares about data centers anymore?

The number of devices worldwide that are connected to each other to collect and analyze data and perform tasks autonomously is projected to nearly triple, from 7 billion in 2020 to over 29.4 billion in 2030.

How many of those devices are located in a known data center?, furthermore, does it really matter where these devices are?

We don’t know who they are, who they are maintained by, or even what country they are in many times, no matter how much data protection laws insist, technology evolves a lot faster than legislation.

The most important challenge is ensuring business continuity, and that task is at the very least difficult when it is increasingly harder to know how to manage a business’ critical infrastructure, because the concept of infrastructure itself is changing.

What does IT infrastructure mean?

The suite of applications that manages the data needed to run your business. Below those applications is “everything else”, from databases, engines, libraries, full technology stacks, operating systems, hardware and hundreds of people in charge of each piece of that great babel tower.

What does business continuity mean?

According to ISO 22301, business continuity is defined as the “ability of an organization to continue the delivery of products and services in acceptable timeframes at a predefined capacity during an interruption.”

In practice, there is talk of disaster recovery and incident management, in a comprehensive approach that establishes a series of activities that an organization can initiate to respond to an incident, recover from the situation and resume business operations at an acceptable level. Generally, these actions have to do with infrastructure in one way or another.

Business continuity today

Before IT was simpler, infrastructure was located in one or more datacenters.

Now, we don’t even know where it is, beyond a series of intentionally fuzzy concepts, but what we do know is that neither the hardware is ours, nor the technology is ours, nor the technicians, nor the networks are ours. Only the data (supposedly).

What does business resilience mean?

It is funny that this term has become trendy, when the basic concept of the creation of the Internet was resilience. It means neither more nor less than that it is not a matter of hitting a wall and getting up, but that of accepting mistakes and moving forward, in other words, being a little more elegant and flexible when facing adversity.

Resilience and business continuity

In these liquid times, where everything flows, you have to be flexible and change the paradigm, that is why there is no longer talk of monitoring but of observability, because that of the all-seeing eye is a bit illusory, there is too much to see. Old models don’t work.

It’s not a scalability problem (or at least it’s not just a scalability problem), it’s a paradigm shift problem.

Let’s solve the problem using the problem

Today all organizations are somehow dissolved in the cloud. They mix their own infrastructure with the cloud, they mix their own technology with the cloud, they mix their own data with the cloud. Why not mix observability with cloud?

I’m not talking about using a SaaS monitoring tool, that would be to continue the previous paradigm, I’m talking about our tool dissolving in the cloud, that our operational knowledge dissolves in the cloud and that the resilience of our organization is based on that, on being in the cloud.

As in the beginnings of the internet, you may cut off a hydra’s head, but the rest keeps biting, and soon, it will grow back.

Being able to do something like this is not about purchasing one or more tools, hiring one or more services, no, that would be staying as usual.

Tip: the F of FMS in Pandora FMS, means Flexible. Find out why.

Resilience, business continuity and cloud

The first step should be to accept that you cannot be in control of everything. Your business is alive, do not try to corset it, manage each element as living parts of a whole. Different clouds, different applications, different work teams, a single technology to unite them all? Isn’t it tempting?

Talk to your teams, they probably have their own opinion on the subject, why not integrate their expertise into a joint solution? The key is not to choose a solution, but a solution of solutions, something that allows you to integrate the different needs, something flexible that you do not need to be in control of, just take a look, just have a complete map, so that whatever happens, you can move forward, that’s what continuity is all about.

Some tips on business continuity, resilience and cloud

Why scale a service instead of managing on-demand items?

A service is useful insofar as it provides customers with the benefits they need from it. It is therefore essential to guarantee its operation and operability.

Sizing a service is important to ensure its profitability and quality. When sizing a service, the amount of resources needed, such as personnel, equipment, and technology, can be determined to meet the demand efficiently and effectively. That way, you will avoid problems such as long waiting times, overwork for staff, low quality of service or loss of customers due to poor attention.

In addition, sizing a service will allow you to anticipate possible peaks in demand and adapt the capacity appropriately to respond satisfactorily to the needs of customers and contribute to their satisfaction. Likewise, it also helps you optimize operating costs and maximize service profitability.

Why find the perfect tool if you already have it in-house?

Integrate your internal solution with other external tools that can enhance its functionality. Before embarking on a never-ending quest, consider what you already have at home. If you have an internal solution that works well for your business, why not make the most of it by integrating it with other external tools?

For example, imagine that you already have an internal customer management (CRM) system that adapts to the specific needs of your company. Have you thought about integrating it with digital marketing tools like HubSpot or Salesforce Marketing Cloud? This integration could take your marketing strategies to the next level, automating processes and optimizing your campaigns in a way you never imagined before.

And if you’re using an internal project management system to keep everything in order, why not consider incorporating online collaboration tools like Trello or Asana? These platforms can complement your existing system with additional features, such as Kanban boards and task tracking, making your team’s life easier and more efficient.

Also, let’s not forget IT service management. If you already have an internal ITSM (IT Service Management) solution, such as Pandora ITSM, why not integrate it with other external tools that can enhance its functionality? Integrating Pandora ITSM with monitoring tools like Pandora FMS can provide a more complete and proactive view of your IT infrastructure, allowing you to identify and solve issues before they impact your services and users.

The key is to make the most of what you already have and further enhance it by integrating it with other tools that can complement it. Have you tried this strategy before? It could be the key to streamlining your operations and taking your business to the next level.

Why force your team to work in a specific way?

Incorporate other equipment and integrate it into your team (it may be easier than you imagine, and much cheaper).

The imposition of a single work method can limit the creativity and productivity of the team. Instead, consider incorporating new teams and work methods, seamlessly integrating them into your organization. Not only can this encourage innovation and collaboration, but it can also result in greater efficiency and cost reduction. Have you explored the option of incorporating new teams and work methods into your organization? Integrating diverse perspectives can be a powerful driver for business growth and success.

Why choose a single cloud if you can integrate several?

The supposed simplicity can be a prison of very high walls, never take your chances on a single supplier or you will depend on it. Use European alternatives to protect yourself from legal and political changes in the future.

Choosing a single cloud provider can offer simplicity in management, but it also carries significant risks, such as over-reliance and vulnerability to legal or political changes. Instead, integrating multiple cloud providers can provide greater flexibility and resilience, thereby reducing the risks associated with relying on a single provider.

Have you considered diversifying your cloud providers to protect your business from potential contingencies? Integrating European alternatives can provide an additional layer of protection and stability in an increasingly complex and changing business environment.

Why choose high availability?

Pandora FMS offers HA on servers, agents and its console for demanding environments ensuring their continuity.

High availability (HA) is a critical component in any company’s infrastructure, especially in environments where service continuity is key. With Pandora FMS, you have the ability to deploy HA to servers, agents, and the console itself, ensuring your systems are always online even in high demand or critical environments.

Imagine a scenario where your system experiences a significant load. In such circumstances, equitable load distribution among several servers becomes crucial. Pandora FMS allows you to make this distribution, which ensures that, in the event of a component failure, the system remains operational without interruptions.

In addition, Pandora FMS modular architecture allows you to work in synergy with other components, assuming the burden of those that may fail. This contributes to creating a fault-resistant infrastructure, where system stability is maintained, even in the face of unforeseen setbacks.

Why centralize if you can distribute?

Choose a flexible tool, such as Pandora FMS.

Centralizing resources may seem like a logical strategy to simplify management, but it can limit the flexibility and resilience of your infrastructure. Instead of locking your assets into a single point of failure, consider distributing your resources strategically to optimize performance and availability across your network.

With Pandora FMS, you have the ability to implement distributed monitoring that adapts to the specific needs of your business. This solution allows you to deploy monitoring agents across multiple locations, providing you with full visibility into your infrastructure in real time, no matter how dispersed it is.

By decentralizing monitoring with Pandora FMS, you may proactively identify and solve issues, thus minimizing downtime and maximizing operational efficiency. Have you considered how distributed monitoring with Pandora FMS can improve the management and control of your infrastructure more effectively and efficiently? Its flexibility and adaptability can offer you a strong and customized solution for your IT monitoring needs.

Contact our sales team, ask for a quote, or solve your doubts about our licenses. Pandora FMS, the integral solution for monitoring and observability.

About Version 2 Limited
Version 2 Digital is one of the most dynamic IT companies in Asia. The company distributes a wide range of IT products across various areas including cyber security, cloud, data protection, end points, infrastructures, system monitoring, storage, networking, business productivity and communication products.

Through an extensive network of channels, point of sales, resellers, and partnership companies, Version 2 offers quality products and services which are highly acclaimed in the market. Its customers cover a wide spectrum which include Global 1000 enterprises, regional listed companies, different vertical industries, public utilities, Government, a vast number of successful SMEs, and consumers in various Asian cities.

About PandoraFMS
Pandora FMS is a flexible monitoring system, capable of monitoring devices, infrastructures, applications, services and business processes.
Of course, one of the things that Pandora FMS can control is the hard disks of your computers.

How to update your PC BIOS

Every computer has its BIOS, short for Basic Input/Output System), which is a firmware installed on the PC’s motherboard. Through the BIOS you may initialize and configure hardware components (CPU, RAM, hard disk, etc.). Let’s say it’s a kind of translator or bridge between computer hardware and software. Its main functions are:

  • Initialize the hardware.
  • Detect and load the bootloader and operating system.
  • Configure multiple parameters of your PC such as boot sequence, time and date, RAM times and CPU voltage.
  • Set up security mechanisms like a password to restrict access to your PC.

Importance of understanding how to access and update the BIOS

Since its main function is to initialize and check that all the hardware components of your PC are working properly, if everything is working correctly, BIOS looks for the operating system on the hard drive or other boot device connected to your PC. However, accessing‌ BIOS may be an unknown process for many users, preventing its update, which can guarantee the performance of the equipment and its security. Later in this blog we will explain how to access BIOS.

Clarification on the non-routine nature of BIOS updates

It is recommended to update BIOS to maintain performance, stability and computer security. Your PC manufacturer can send BIOS updates to add features or fix some bugs. The process is overall simple, but it must be done with great care to avoid irreversible damage. Also, it should be avoided to turn off or cut off the power in the middle of an upgrade process with serious consequences for the equipment.

Accessing the BIOS from Windows

To access BIOS, there are several options, from the following buttons, depending on the brand of your computer:

  • Dell: F2 or F12
  • HP: F10
  • Lenovo: F2, Fn + F2, F1, or Enter followed by F1
  • Asus: F9, F10 or Delete
  • Acer: F2 or Delete
  • Microsoft Surface: Hold the volume up button pressed
  • Samsung/Toshiba/Intel/ASRock/Origin PC: F2
  • MSI/Gigabyte/EVGA/Zotac/BIOStar: Delete

Instructions for accessing the BIOS from Windows 10 or 11 through Settings and the Advanced Start option

Just follow these instructions:

  • Restart your computer and wait for the manufacturer’s logo to appear.
  • Press the key one of the keys mentioned above when viewing the home screen to access the BIOS settings.
  • Once in the BIOS, you may navigate through the different options using the arrow keys on your keyboard.

You may also follow this process in Windows 11:

  • On the login or lock screen, press the Shift key on your keyboard and tap the power button (or click the power option at the bottom right of the login screen). Then choose the Reset option from the menu.
  • When Windows 11 restarts, you will be shown the advanced startup screen (choose an option).
  • Then scroll to Troubleshoot > Advanced Options > UEFI Firmware Settings and click Restart.

Since BIOS configuration can have an impact on the operation of your PC, it is recommended to seek help from a professional.

Alternatives to using the Windows 10 and 11 method if the operating system loads too fast to access BIOS.

An alternative to start Win11 BIOS configuration is from the Settings application. Just follow these three steps:

  • Open Windows 11 Settings
  • Navigate to System > Recovery > Restart now.
  • Before you click Restart Now , save your work.
  • Next, go to Troubleshooting > Advanced Options > UEFI Firmware Configuration and click Restart. (we will talk about UEFI later in this blog post)

Another alternative is to use the Windows Run command:

  • Open up the Run box (by pressing the Windows + R keys).
  • Then type shutdown /r /o , and press Enter . A shortcut is to type shutdown /r/o/f /t 00 and click OK .
  • Then select Troubleshoot > Advanced Options > UEFI Firmware Configuration and click Restart to boot into the system BIOS settings.

By the command line, also:

  • Open CMD, PowerShell or Terminal.
  • Type in shutdown /r /o /f /t 00 o shutdown /r /o and press Enter.
  • Then go to Troubleshooting > Advanced Options > UEFI Firmware Configuration and click Restart to get to the Windows 11 BIOS/UEFI configuration.

A more customized option is by shortcut:

  • Right-click on the Windows 11 desktop and select New > Shortcut.
  • In window Create Shortcut, enter shutdown /r/o /f /t 00 or shutdown /r /o to locate it.
  • Follow the instructions to create a BIOS shortcut.

Once the BIOS configuration shortcut is created, just double-click it and choose Troubleshooting > Advanced Options > UEFI Firmware Configuration and click Restart to boot your PC into the BIOS environment.

What does UEFI stand for?

UEFI (Unified Extensible Firmware Interface) has emerged as the most modern and flexible firmware with new features that go hand in hand with today’s needs for more volume and more speed. UEFI supports larger hard drives and faster boot times.

UEFI advantages:

  • Easy to program since it uses the C programming language. With this programming language you may initialize several devices at once and have much faster booting times.
  • More security, based on Secure Boot mode.
  • Faster, as it can run in 32-bit or 64-bit mode and has more addressable address space than BIOS, resulting in a faster booting process.
  • Make remote support. easier. It allows booting over the network, and may also carry different interfaces in the same firmware. A PC that cannot be booted into the operating system can also be accessed remotely for troubleshooting and maintenance.
  • Safe booting, as you may check the validity of the operating system to prevent or check if any malware tampered with the booting process.
  • More features and ability to add programs. You may also associate drivers (you would no longer have to load them into the operating system), which is a major advantage in agility.
  • Modular, since modifications can be made in parts without affecting the rest.
  • CPU microcode independence.
  • Support for larger storage drives, with up to 128 partitions.

Additionally, UEFI can emulate old BIOSes in case you need to install on old operating systems.

Continued use of the “BIOS” term to refer to UEFI for simplicity

BIOS is still used to initialize and check the hardware components of a computer to ensure proper operation. Also, as we have seen, it allows you to customize PC behavior (which boots first, for example). So BIOS is still helpful in troubleshooting issues that prevent the PC from booting properly.

When should you update your BIOS?

Reasons to perform a BIOS update

Updating the BIOS (or UEFI), as we mentioned before, helps the system work with better performance, in addition to checking and adjusting the installed hardware, which in turn ultimately impacts software operation. It is recommended to update BIOS only if there is a necessary improvement in the new version.
Sometimes, it is necessary to update BIOS so that the motherboard supports the use of a new generation processor or other type of hardware.

Warning about the potential risks of a BIOS update

The recommendation to update BIOS only when it is a necessary part of the possibility that the updating process​ fails, leaving your computer inoperable (!). Another risk is data loss if something fails during the upgrade (a connection outage, power, incomplete process). It considers that there may be unexpected errors that may result in a direct impact on the operation ‌of your computer. That is why it is recommended to ask for professional support to do so.

How to update your BIOS

Although each manufacturer recommends a process and their own tools for updating BIOS, you may say that the first step is always to back up the most critical data on your computer, in case something goes wrong in the process (hopefully not!). To do so, the following is recommended:

Identification of the motherboard model and BIOS using Windows system information

The BIOS update is based on the model data of the motherboard or computer. To find out, press the Windows key on your PC and type System Information . The service window will open in which all the details of the installed software will be listed. You will see the System Model and BIOS Version and Date, for the BIOS manufacturer’s name, BIOS version, and release date. With this data you will know which version of the BIOS to download (it must be later than the one you installed).

However, the most common method of updating BIOS is through an update wizard program, which takes you by the hand throughout the update process and runs from the operating system. Only indicate where the BIOS update file is located and restart the PC.

Steps to download and install the BIOS update according to the manufacturer’s instructions.

Generally, the manufacturer of the motherboard of your PC has not only an update wizard program but also the BIOS update file, such as the wizard program itself, which you may download from the support page of the manufacturer of your computer or motherboard.
Once you obtain the BIOS installation wizard and the latest version of the BIOS, download them to your computer. It is important to mention that it is not recommended to use Beta versions of BIOS updates. It is preferable to keep the latest stable version, even if it is older.
Let the update wizard take you by the hand and use the BIOS update file to indicate that this is the new firmware to be installed. In case the downloaded update file is invalid or more updated to what you already have installed, the wizard software will detect it and will not perform the update.
Once this is done, restart your PC. We recommend that you check the main settings, checking that the date and time are correct, the boot order is correct (i.e. which hard drive is checked first for a Windows installation) and check that everything else is correct.
Now, you may continue working with the new BIOS version.

BIOS Update Considerations

Before making any BIOS updates, it is always recommended to back up the data so that this does not become your nightmare. For BIOS update, please consider these considerations:

  • Updating the BIOS generally does not improve performance, so it should be done only if necessary.
  • As we have seen, there are several methods for updating the BIOS, increasingly intuitive such as those in which the manufacturer itself offers an update wizard program that takes you by the hand throughout the process. It is important to follow the instructions that the manufacturer of your equipment indicates to prevent it from becoming unusable.
  • Always investigate BIOS corruption recovery options and have that information handy. That is: get ready for any contingency. Many times, despite precautionary measures, the upgrade may fail, either due to incompatibility issues or an unfortunate blackout or power outage. Should that happen, and if the PC is still working, do not turn off the computer. Close the flash update tool and restart the update process to see if it works. If you made a BIOS backup dtry selecting this file to recover it.

Also some motherboards have backup BIOSes that help restore the BIOS. Or, the manufacturer sells BIOS chips from its online store, at a good price.
Finally, we would like to repeat once again the recommendation that you rely on an expert to update the BIOS.

Olivia Diaz

Market analyst and writer with +30 years in the IT market for demand generation, ranking and relationships with end customers, as well as corporate communication and industry analysis.

Analista de mercado y escritora con más de 30 años en el mercado TIC en áreas de generación de demanda, posicionamiento y relaciones con usuarios finales, así como comunicación corporativa y análisis de la industria.

Analyste du marché et écrivaine avec plus de 30 ans d’expérience dans le domaine informatique, particulièrement la demande, positionnement et relations avec les utilisateurs finaux, la communication corporative et l’anayse de l’indutrie.

About Version 2 Limited
Version 2 Digital is one of the most dynamic IT companies in Asia. The company distributes a wide range of IT products across various areas including cyber security, cloud, data protection, end points, infrastructures, system monitoring, storage, networking, business productivity and communication products.

Through an extensive network of channels, point of sales, resellers, and partnership companies, Version 2 offers quality products and services which are highly acclaimed in the market. Its customers cover a wide spectrum which include Global 1000 enterprises, regional listed companies, different vertical industries, public utilities, Government, a vast number of successful SMEs, and consumers in various Asian cities.

About PandoraFMS
Pandora FMS is a flexible monitoring system, capable of monitoring devices, infrastructures, applications, services and business processes.
Of course, one of the things that Pandora FMS can control is the hard disks of your computers.