Skip to content

IT Event Console: Centralize Logs, Correlate Alerts, and Detect Incidents

When you’re just starting out, you might picture yourself managing your IT infrastructure like Tom Cruise in Minority Report—key information projected in front of you, predicting events before they happen, controlling everything at the speed of thought with cinematic gestures on some kind of holographic computer. But in real life, that infrastructure looks more like a Frankenstein’s monster: a mashup of different technologies, open and closed source tools, various applications and protocols stitched together however possible. We may never be Tom Cruise, but we can get a little closer to his character’s futuristic setup with an IT event console.
Today, one of the biggest challenges in technology management is handling the massive volume of scattered events across complex environments—systems that were never really designed to work together. Efficient management is impossible without unification, and that’s where an IT event console comes in. In this post, we’ll explore everything you need to know: what it is, how it works, benefits, use cases, and more.

What Is an IT Event Console?

An IT event console (not to be confused with the Windows Event Viewer) is a tool designed to add, correlate, and prioritize real-time events coming from multiple sources—servers, networks, applications, IoT devices, and more.
Its main goal is to optimize operational response by filtering out the “noise” and enabling technical teams to act quickly on critical incidents. This ensures systems continue running smoothly and, in the event of issues, guarantees immediate action to minimize downtime, system underperformance, or any other disruption.
Think of the IT event console as a command center for incidents, where all significant events can be monitored and controlled. In fact, at Pandora FMS we call our Metaconsole the Command Center—the crown jewel that lets you feel a bit like Tom Cruise (minus the money, success, looks, and fame) as you manage hundreds of thousands of devices and all their associated events from a single place.
It’s important to note that an event console is not the same as a SIEM (Security Information and Event Management) system. A SIEM focuses on cybersecurity and compliance, whereas an IT event console serves as a broader command hub.
With the event console, you’re ensuring everything is running optimally in terms of performance and service. Yes, it includes security events—but it goes beyond that. If a SIEM is your police detective, the IT event console is more like a super-engineer watching over the entire system for critical operational issues.

What Types of Events Are Managed in IT

When we talk about events in IT, we’re referring to signals that indicate something is happening in our operations or security. And, as life tends to go, those occurrences aren’t usually good—they range from minor failures to critical threats (like something going offline, underperforming, or coming under attack).
As we’ll explore in more detail, these signals are uncovered by aggregating, analyzing, and correlating logs of all kinds—network, system, application, etc. The key point is that an IT event console’s job is to notify us about critical events—not every little thing that happens. Otherwise, we’d just be trading blindness for madness (well, more madness) from constant alerts.
So, what makes an event critical?

  • It impacts operations. For example, the server used by your sales team to log deals goes down, and they can’t work; or the POS system stops working and you’re losing money by the minute.
  • It prevents regulatory compliance. Like with GDPR or PCI DSS, where violations could lead to hefty fines.
  • It poses a security threat. An exploited vulnerability could put your data at risk.
  • It has a certain scale, importance, or recurrence. A one-time CPU spike or a system reboot that never repeats might not be considered critical.

How an IT Event Console Works

To display key information, the event console must work behind the scenes with logs from networks, systems, security, and applications. It generally follows these steps:

  • Log Collection. This can happen via agents installed on systems, EDRs, direct log ingestion, or any other telemetry method. The goal is to gather everything in one central place.
  • Normalization and Compatibility. Collecting data isn’t enough—thanks to the “Frankenstein effect” of most infrastructures, you’ll have a Tower of Babel of standards, formats, and behaviors. That’s why we need to unify and interpret them all, like using Star Trek’s universal translator, normalizing the data so it can be processed and correlated.
  • Automatic Filtering and Validation. You’ll receive thousands of events, but you only want the critical ones. It’s time to sift through them so the console only shows what matters. However, there’s another step that must run in parallel.
  • Event Correlation. Using predefined rules, patterns, and thresholds, we combine data to retrieve insights beyond the sum of the parts. For example, a connection to a “trusted” external domain like Google Drive might not seem suspicious on its own and wouldn’t trigger a critical alert. But if we correlate it with logs showing large, encoded, regular outbound traffic during off-hours from certain endpoints, it could indicate potential data exfiltration.
  • Operational Visualization and Alert Generation for Critical Events. Whether it’s a single-point alert (like a server going down with no clear reason) or a correlated analysis (like realizing that server crashes happen at specific times because sales teams are uploading massive amounts of data—and, unfortunately, you assigned that task to an old Raspberry Pi), the console delivers actionable insight.

Key Benefits for IT Management

Reading the above, it’s easy to see the advantages an IT event console brings to your daily operations, such as:

  • Centralized Visibility of What Matters in Your Infrastructure. Making the old dream come true: your chair feels more like the captain’s seat on the Enterprise, with all critical systems visible and running as one under your command. Though, granted—no Minority Report hand gestures or Star Trek-style voice commands… yet.
  • Reduction of False Positives. Say goodbye to operational “noise” with correlation rules that group related events (triggering a single alert instead of a hundred), filter out irrelevant data (like scheduled reboots), or prioritize based on impact—like detecting an abnormal spike in encrypted outbound traffic, which might indicate a serious security breach.
  • Cross-Team Coordination. Security, performance, support… the console not only unifies tools, but also aligns people and departments. Now everyone has access to the same key data to make optimal decisions together, rather than each team fighting its own battle in isolation.
  • Regulatory Compliance and Auditing. Supporting compliance with GDPR, NIS2, ISO 27001, or whatever standard applies through: centralized log maintenance ready for audit, automated and customizable reporting (with advanced options like those from Pandora FMS), and proactive monitoring of critical requirements—such as MFA for sensitive data, and alerts if accessed without it.

Real-World Use Cases

An IT event console is not just a theoretical concept for optimal infrastructure management—it’s a practical tool conceived to solve problems and make your life easier, as shown in the following real-world use cases.

Hybrid Infrastructures (Cloud and On-Premises)

A mixed architecture is quite common today, using SaaS services like Salesforce or Office 365 alongside clouds such as AWS and on-premise servers (for sensitive data or backups, for example). So how does an IT event console help in these scenarios?
To begin with, it can collect and analyze local Syslog data, AWS API metrics, and error logs from Office 365 together. Imagine that one day your users complain they can’t work with Microsoft’s suite—but why? Thanks to integration and correlation behind the scenes, the console might reveal whether the issue is local network latency, a cloud API timeout error, or something else entirely.
Let’s go back to our sales team for a moment—those who swapped the old Raspberry Pi setup for Salesforce. They now input their data there, but for some reason, it’s not syncing properly with the ERP system, which we’re still hosting on-premises. The console could detect, for instance, that the local ERP server’s CPU is hitting 100% during certain hours, alongside a wave of 504 timeout errors in the API. That tells us Salesforce isn’t to blame—we’re simply under-provisioned on the local server side, and it’s time to scale up.

SOC Environments (Threat Detection and Response)

While the IT event console isn’t limited to cybersecurity, it certainly includes it—because of how critical security has become. EDRs and firewalls generate massive volumes of alerts for potential breaches, but many are noise or false positives.
The console helps by correlating different types of events to identify which ones represent real threats. For example, a phishing campaign is detected via inbound email scanning. Then, an EDR on a user’s endpoint triggers a malicious process alert, and suspicious IP traffic is flagged showing C2 (command and control) behavior.
This global, correlated view confirms that some phishing emails slipped through, and—one of the few universal truths—there’s always a user eager to click where they shouldn’t.
The console can alert the SOC team, and depending on your defense systems, automated responses may already be in play (like blocking the malicious IP or isolating the user’s laptop with the itchy trigger finger).

Distributed Monitoring (of Endpoints, Networks, and Services)

Today’s companies have employees working from the office, from home, remotely across countries, with all kinds of servers—both SaaS and on-premises—as well as IoT devices. Good luck trying to manually monitor each one of them.
An IT event console makes it possible to scan thousands of devices in just minutes (for instance, Pandora FMS’s Metaconsole can handle hundreds of thousands centrally), allowing you to see how everything is performing and to set thresholds and alerts for anomalies across systems—such as unscheduled reboots, offline statuses, or unusual CPU spikes.

How Pandora FMS Handles It

One of Pandora FMS’s greatest strengths is providing that feeling of control (because we’ve experienced the stress and frustration of not having it) and doing the heavy lifting of collecting, normalizing, and processing key information from logs, to present you with only the critical events.
The crown jewel here is the Metaconsole, which I’ve briefly mentioned before, called the Command Center. It allows you to monitor as many infrastructure components as needed, showing color-coded alerts at a glance based on severity.
Within its interface, there’s also an event management menu. When accessed, you’ll see a color-coded list again, helping you quickly identify severity levels and what they correspond to (blue for maintenance, green for normal, yellow for warning, red for critical, etc.). This provides total control and management capability, allowing you to filter by time, status, take action, and more.
Likewise, you can access the alerts section to review their type, generate reports, or build custom dashboards that allow you to instantly see the status of what matters most—based on your operational needs, not those dictated by the console vendor.
Within this command center, you can also create so-called visual consoles. Thanks to a wizard-based system, you can easily add elements or services, building exactly what you need to take full control of your operations—your reins, your horse.
And it’s all done through an intuitive and visually appealing interface. But as the best stories say, beauty lies within—and that’s true here too. Because the strength of Pandora FMS isn’t just skin deep.
Behind the scenes, correlation and automation rules work tirelessly, built on best practices. Logs in various formats are collected and unified, and integration with ITSM and SIEM tools ensures that alerts, security actions, and tickets are synchronized and working in harmony.

Best Practices for Implementing an IT Event Console

Let’s remember that the purpose of the console is not to report everything that happens, but only what truly matters. To achieve that, these best practices will help:

  • Design correlation rules. Create rules based on real-world patterns and historical data, avoiding ambiguity and fine-tuning thresholds to minimize false alarms.
  • Prioritize critical events. Classify events by impact/urgency to focus on those that threaten revenue, operational continuity, or security.
  • Automate without overloading. Only automate predictable tasks, maintaining human oversight for complex decisions and monitoring the effectiveness of automated scripts.
  • Integrate with operational workflows. Connect the console with ticketing and communication tools—like Pandora FMS does—to unify alerts, actions, and follow-up, eliminating fragmented knowledge silos or manual steps like creating tickets.
  • Start small. It’s easy to get carried away by the power and control of an IT event console, but it’s better to start gradually—you can always add more rules and interactions over time.

All this will help you find the needle of what matters in the haystack of thousands of scattered, heterogeneous logs.
Optimal management always begins with control, and that control starts with the proper handling of information and analysis to bring what matters to light. The key to all these doors is an IT event console—one that alerts you to what’s important without overwhelming you with noise in a context that already has too much of it.

About Version 2 Limited
Version 2 Digital is one of the most dynamic IT companies in Asia. The company distributes a wide range of IT products across various areas including cyber security, cloud, data protection, end points, infrastructures, system monitoring, storage, networking, business productivity and communication products.

Through an extensive network of channels, point of sales, resellers, and partnership companies, Version 2 offers quality products and services which are highly acclaimed in the market. Its customers cover a wide spectrum which include Global 1000 enterprises, regional listed companies, different vertical industries, public utilities, Government, a vast number of successful SMEs, and consumers in various Asian cities.

About PandoraFMS
Pandora FMS is a flexible monitoring system, capable of monitoring devices, infrastructures, applications, services and business processes.
Of course, one of the things that Pandora FMS can control is the hard disks of your computers.

Install Pandora ITSM from Pandora FMS Console

Until now, deploying Pandora ITSM required a standalone installation, manual database configuration, and later integration with Pandora FMS. With the new NG 783 version, that entire process has been simplified: Pandora ITSM can now be installed directly from the Pandora FMS web console, no additional servers, no external steps, and with integration already configured.

A Single Workspace, No Middle Steps

The new installer automatically detects whether an ITSM database already exists. If not, it creates one and applies all necessary setup (table structure, initial data load, access setup, and authentication configuration). There’s no need to enter credentials or perform extra configurations—the installation automatically adapts to the available permissions in the environment.

Integrated Authentication and Synchronized Users

Once the installation is complete, Pandora FMS administrator users are automatically synchronized with ITSM, without the need to manage separate accounts. ITSM is ready to authenticate directly using the main system’s users, following the same logic already used for LDAP or Active Directory integrations.

Additionally, any pre-existing users in ITSM are removed to avoid license conflicts and ensure that access control remains centralized within Pandora FMS.

Native Integration with Contextual Access

Pandora FMS console now includes a dedicated ITSM menu, with direct links to the incident and change management environment. This native integration enables work within a unified interface, where monitoring alerts can automatically generate incidents in ITSM—without switching contexts or duplicating tools. It strengthens the connection between the alert and notification system and operational management.

Once the process is complete, a summary is displayed showing the generated access points and the full URL of the ITSM environment, already integrated and ready to use.

About Version 2 Limited
Version 2 Digital is one of the most dynamic IT companies in Asia. The company distributes a wide range of IT products across various areas including cyber security, cloud, data protection, end points, infrastructures, system monitoring, storage, networking, business productivity and communication products.

Through an extensive network of channels, point of sales, resellers, and partnership companies, Version 2 offers quality products and services which are highly acclaimed in the market. Its customers cover a wide spectrum which include Global 1000 enterprises, regional listed companies, different vertical industries, public utilities, Government, a vast number of successful SMEs, and consumers in various Asian cities.

About PandoraFMS
Pandora FMS is a flexible monitoring system, capable of monitoring devices, infrastructures, applications, services and business processes.
Of course, one of the things that Pandora FMS can control is the hard disks of your computers.

What Is Session Replay and How It Improves User Experience in IT Environments

Anyone who works in technology quickly learns this truth: users will always interact with systems in the most unexpected and baffling ways… and when something goes wrong, they swear they “didn’t touch anything.” There’s a vast ocean between how something is designed and how it’s actually used—an ocean filled with bugs waiting to be caught. But there’s a way to bridge that gap: session replay.
Thanks to this event-capturing and playback technique, we can align technology with user experience, boosting both user satisfaction and technical support efficiency. In this article, we’ll explore what session replay is, how it differs from other monitoring tools, and how to apply it to create happy users—and technicians who don’t feel like strangling them.

Improving User Experience Through Monitoring

Technology only fulfills its true purpose when it benefits the user —boosting productivity, enhancing comfort, and simplifying tasks. That positive experience is essential for technology adoption and long-term success. That’s why observing how users interact with technology to prevent issues and optimize performance is no longer optional.
Often, companies try to improve user experience through surveys or feedback forms. But in many cases, the technician is disconnected from the end-user process (because they don’t use the system daily), and the user isn’t equipped to articulate how to improve it—or even what went wrong—due to a lack of technical understanding.
Session replay removes those barriers.

What Is Session Replay and How Does It Differ from Other UX Techniques?

Session replay is a technology that records a user’s interactions on a website or application—capturing events like clicks, scrolling, and form inputs, as well as changes to the DOM (Document Object Model). Using this structured data, it reconstructs the user’s session step-by-step, allowing teams to visually observe behavior and troubleshoot more effectively.
Session replay isn’t the only method available for understanding user behavior. Other options include:

  • Session recording. Captures user sessions as video footage of screen activity, while session replay uses structured event data to recreate the session more precisely and flexibly.
  • Heatmaps. Provide aggregated visual data showing where users click or scroll most often, but don’t offer insights into individual sessions or their chronological flow.
  • Traditional analytics. Offer quantitative metrics such as bounce rates and time on page, but lack the visual context and detailed workflow progression that replay provides.

How Does Session Replay Work Technically?

Session replay works by capturing detailed data about what happens on a page or application through multiple sources:

  • Changes in the DOM (Document Object Model): This includes dynamic updates triggered by technologies like AJAX.
  • User events and inputs: Such as clicks, keystrokes, form submissions, and navigation actions.
  • Visual or screen captures: Using snapshots to detect elements like custom fonts or complex CSS that may not be reflected accurately through DOM changes alone.

These events are typically stored in structured formats (e.g., JSON) and later used to reproduce the session using rendering engines such as WebSocket streams or WEBGL.
This reconstruction enables a precise, step-by-step replay of the user’s experience—often including elements and data that video-based session recordings cannot capture or parse from motion imagery.
However, like everything in life, session replay has its limitations.
For instance, on mobile devices, capturing system-level events depends heavily on the SDK provided. Web technologies like Canvas or WebGL might not be easily recordable, especially if privacy-conscious users block their access. For example, someone using Firefox with Enhanced Tracking Protection enabled—especially if they block Canvas to prevent fingerprinting—may render session replay ineffective for any site relying on Canvas-based rendering. Likewise, popular ad blockers like uBlock Origin can block replay scripts if they’re flagged as potential trackers.
These restrictions can reduce the accuracy and completeness of session replay data in reproducing the user’s actual experience.

Use Cases of Session Replay

Being able to “look over the user’s shoulder” and gather structured, analyzable data is incredibly valuable—not to fulfill a dystopian surveillance fantasy, but to better understand and improve the user experience while speeding up issue resolution.
Here are some of the most common session replay use cases:

  • In UX. To identify and eliminate friction points in web/app usage, improve usability, increase efficiency, and ensure the technology works for the user—not against them.
  • In Product Development. To analyze how the product is actually used (spoiler: it’s never exactly as intended), determine which features are most adopted, and evaluate the impact of newly released features. The goal is to align the product with real user needs.
  • In Business and Marketing. To improve conversion rates by identifying pain points, understanding where users drop out of the sales funnel, and learning why they abandon a process.
  • In Technical Support. To reduce the volume of support tickets and, most importantly, to see what really happened behind the user’s all-time favorite sentence: “I didn’t touch anything.”

Technical Challenges and Limitations of Session Replay

While session replay delivers structured and actionable data far more useful than raw video recordings (which require tedious manual review), this technology comes with several important challenges.
For instance, capturing too many interactions may generate excessive data, much of which may not be meaningful. This overload can lead to slower system performance and storage issues—ironically degrading the user experience it aims to improve.

If most sessions recorded are irrelevant to the goal being analyzed (e.g., test environments, bots, or edge cases), any conclusions drawn—no matter how sophisticated the analysis—may be misleading or irrelevant.

Deploying session replay can resemble a digital “surveillance state” if not implemented carefully. It tracks everything the user does, which means mishandling the data or failing to follow best practices can lead to privacy violations or legal issues.

Common Mistakes and Best Practices with Session Replay

To avoid technical pitfalls or legal issues, the first step is steering clear of the most common mistakes:

  • Recording Everything: More data doesn’t equal more insight. Without filtering based on specific objectives, you’ll bog down system performance and fill storage with irrelevant information.
  • Failing to Anonymize: Privacy is crucial and so are the penalties for neglecting it. Always anonymize sensitive data. Remember: session replay is meant to improve usability, not act as surveillance.
  • Lack of Context: Data alone is meaningless without proper context. For example, if a session appears slow, replaying it without correlating other data (like CPU load or concurrent processes) won’t reveal the root cause.

Once these issues are addressed, here are some best practices to follow:

  • Set Clear Goals: Define exactly what you wish to understand—then collect only the data needed to meet that goal. Efficiency is key.
  • Segment Sessions and Data: Categorize by behavior, such as users who abandoned a shopping cart or used a new feature in your application, to make targeted improvements.
  • Correlate with Quantitative Analytics: Combine session replay insights with traditional analytics (e.g., Google Analytics) for a broader understanding. This layered approach is especially helpful when assessing the impact of UI or UX changes.

Popular Session Replay Tools

If this topic has sparked your interest, there are several session replay solutions available—here’s a comparison of some of the most widely used tools:

Tool

Type

Strengths

Limitations

Best for

Mixpanel

SaaS (Proprietary)

Integration with product analytics

Advanced event filtering

Free tier available

High cost for unlimited sessions

Less technical depth (focuses on product and marketing)

Product and marketing teams focused on funnel optimization and data-driven decisions

Amplitude

SaaS (Proprietary)

Correlates sessions with business metrics

A/B testing support

Free tier available

Complex setup

Expensive with large data volumes

Businesses focused on user conversion and retention

Datadog

SaaS (Proprietary)

Integrates with logs, APM, infrastructure metrics

Full-stack visibility

Risk detection with ML

Less UX-focused

High cost for small teams with many hosts

DevOps teams needing complete observability

PostHog

Open Source / SaaS

Self-hosting available

Full suite (recording + analytics)

Requires technical upkeep in self-hosted setup

Startups or tech teams with tight budgets

OpenReplay

Open Source /SaaS

Free and self-hostable

Built-in sensitive data masking

Fewer native integrations compared to SaaS tools

Organizations with strict privacy or data control requirements

How to Choose and Configure the Right Session Replay Tool

Which tool to choose depends on your organization, its goals… and of course, its budget—because that’s how real life works.
If you need total control and strong anonymization, you might lean toward OpenReplay hosted on your own servers. But if your focus is on the business side, like understanding the customer journey through your product or website, Amplitude and Mixpanel are purpose-built for that.
Key factors to evaluate when choosing a tool:

  • Data capture capabilities and how the tool filters that data.
  • Data retention policies and storage duration
  • Scalability, especially if you plan to expand to more systems or expect growth in users.
  • Integration with your existing infrastructure and whether the tool works well with your other analytics and data sources.

General Best Practices for Secure and Effective Setup:

  • Start small: Only collect critical data initially—you can always expand later.
  • Monitor what’s collected: Check out the insights you’re actually gaining from the captured data.
  • Evaluate impact: Check whether session replay affects system performance or storage capacity.
  • Configure privacy settings carefully: This is essential and deserves special attention to avoid compliance or trust issues.

Session Replay Privacy, Anonymization, and Regulatory Compliance

In this era of increased scrutiny over every tech move, it’s critical to emphasize that session replay is meant to generate insights that enhance user experience and streamline bug resolution through aggregate data—not to spy on individual behavior. However, since it involves tracking events like keypresses or page visits, privacy concerns must be taken seriously.
Keypress data can inadvertently capture sensitive inputs, like passwords, or expose visits to pages containing intimate personal information.
That’s why it’s essential to comply with relevant data privacy regulations, depending on your organization’s location and audience. For example:

  • GDPR (General Data Protection Regulation) in the European Union, which requires collecting only the minimum necessary data, mandates explicit user consent when collecting personal data (e.g., email addresses, IPs) and guarantees the right to be forgotten, meaning users can request erasure of their data.
  • PCI-DSS (Payment Card Industry Data Security Standard):. Prohibits the recording of card numbers, CVV codes, and PINs under any circumstances.

Fortunately, most modern session replay tools are designed with these risks in mind and offer built-in privacy features, such as: real-time field masking (replacing sensitive input with asterisks); selective data exclusion, especially for sensitive HTML input types; options to hash or omit IP addresses entirely. Still, organizations must carefully tailor these privacy configurations to match their specific use cases and compliance requirements.

Session Analysis: Methodology and Patterns

The best tool is useless if we don’t apply best practices. That’s why, regardless of the session replay solution you choose, the basic usage methodology should be:

  • Clearly define your objectives. We don’t implement session replay just because it’s trendy or to show off. The first step is to clearly define the goal. Is it to improve the user experience? Increase online store sales? Enhance employee productivity?
  • Translate goals into key indicators. How do we measure whether the goals are being met? This is where KPIs come in. These might include conversion rates, shopping cart abandonment rates, the number of records entered in a work application, or the average time it takes to complete those records.
  • Verify if session replay provides the necessary data for the KPIs, and integrate with other sources if needed (such as traditional analytics).
  • Identify patterns and anomalies. Session replay delivers a wealth of information, but we must first identify common patterns and anomalies. Why do users coming from marketing emails abandon purchases more often than those arriving via Google? Perhaps the email messaging doesn’t match the landing page.
    Why are there clicks in areas where there shouldn’t be any during CRM data entry? It might signal a UX issue.
  • Propose improvements based on those insights.
  • Repeat the above steps, implementing continuous improvement based on real data.

Practical Example of Using Session Replay to Fix Errors

One of the most common uses of this technology is troubleshooting errors in apps and software tools. When an issue occurs, session replay replaces the typically unproductive exchange between technician and user, which usually goes something like: “I don’t understand your language and I have no idea what those things you’re asking me are.”
However, when error reports come in, we can turn to session replay to see what really happened—no need for patience or the Star Trek universal translator to bridge the tech-user language gap.
With session replay, the tool shows what actually took place—what the user clicked on in the application—and confirms the universal truth: users always lie when they say they didn’t touch anything.
Let’s say there’s an error during checkout in an online store. Users report that after entering their credit card, the “Buy” button doesn’t work. With session replay, the technician observes that in 90% of the cases, users are clicking on a ghost element: a misrendered CSS overlay that loads incorrectly on iOS 16, for example. As a result, the click event never reaches the button. Additionally, the JavaScript console logs a CORS error when loading the payment gateway.
Without session replay, the issue might have been blamed on a weak client connection—resulting in lost sales. But thanks to it, the technician sees that the user clicked the invisible button 17 times due to broken CSS… and can go yell at the front-end team (whom they probably don’t consider “real” engineers anyway).

How Pandora FMS Implements Real Session Recording

Given the immense usefulness of the features discussed, Pandora FMS enables the recording, playback, and analysis of user sessions (both web and Windows-based). While it doesn’t record sessions in a “video-style” like some other session replay tools, it offers a structured and automated approach to user experience monitoring, based on recorded scripts, phase-by-phase timing, screenshots, and alerts.
For web sessions, Pandora FMS combines its WUX (Web User Experience) module, the PWRD (Pandora Web Robot Daemon) automation engine, and the Selenium IDE, enabling:

  • Recording of browser interactions.
  • Creation of scripts that automatically replay those sessions.
  • Breakdown into phases for more detailed analysis.
  • Capturing of screenshots in the event of a failure.
  • Collection of key metrics and configuration of alerts.

For Windows desktop sessions, Pandora leverages its PDR (Pandora Desktop Recorder) module to:

  • Record user actions (typing, window switches, etc.).
  • Automate desktop processes by simulating a real user.
  • Execute recorded scripts for continuous monitoring.
  • Capture the screen upon encountering errors.
  • Segment sessions by phase to obtain detailed performance metrics.

What Sets Pandora FMS Apart from Other Session Replay Tools

The way Pandora FMS captures and implements session replay capabilities goes beyond the standard features found in most tools. Its structured recording approach enables:

  • Continuous monitoring and proactive error detection, allowing issues to be resolved before they impact production environments.
  • Detailed error display and full traceability of what took place, including screenshots and step-by-step or phase-based timing data.

The key difference is that while most session replay tools passively observe what happened, Pandora FMS helps act and prevent. It programmatically replays what should happen, detecting functional deviations before real users are affected—shifting from inert playback used for post-mortem analysis to proactive prevention.
This not only reduces errors and improves user experience—turning frustrated users into happy, productive ones—but also spares IT teams from digging through endless session recordings looking for the proverbial needle in the haystack. In the end, neither the users nor the technicians will feel like smashing their keyboards in frustration.

About Version 2 Limited
Version 2 Digital is one of the most dynamic IT companies in Asia. The company distributes a wide range of IT products across various areas including cyber security, cloud, data protection, end points, infrastructures, system monitoring, storage, networking, business productivity and communication products.

Through an extensive network of channels, point of sales, resellers, and partnership companies, Version 2 offers quality products and services which are highly acclaimed in the market. Its customers cover a wide spectrum which include Global 1000 enterprises, regional listed companies, different vertical industries, public utilities, Government, a vast number of successful SMEs, and consumers in various Asian cities.

About PandoraFMS
Pandora FMS is a flexible monitoring system, capable of monitoring devices, infrastructures, applications, services and business processes.
Of course, one of the things that Pandora FMS can control is the hard disks of your computers.

Optimize Your Event Analysis: Reports, Dynamic Filters, and Log Parsing in Pandora FMS SIEM

The latest Pandora FMS version presents key improvements to the SIEM, module, designed to enhance security event detection and management. These new features are available starting with Feature Release 782, allowing for optimized log analysis, report generation, and rule validation in distributed IT environments.
The SIEM module enables organizations to work with security events that are enriched and generated through log collection and other monitoring data sources. By applying custom correlation rules, it allows you to visualize critical data to detect threats and anomalies. This feature is essential for organizations that require advanced infrastructure monitoring, integrating security event analysis as part of their cybersecurity strategy.

SIEM’s Technical Architecture in Pandora FMS

The SIEM processes events in two main phases: log and monitoring event decoding, and the generation of structured events enriched with security information, applying predefined rules in a process called decoding. This architecture makes it possible to integrate data from IDS and IPS systems and detect vulnerabilities following the CVE standard. OpenSearch works as the storage and search engine, ensuring high performance even under heavy workloads.

Once raw and encoded data is collected, correlation is performed using specific SIEM rules that allow for time-window evaluation of relationships between different rules for the same event, or correlation between multiple different events. Pandora includes thousands of default rules, though the true power of a SIEM lies in its ability to easily define custom rules or import/convert rules from similar systems for use within Pandora.

Pandora’s multi-layer architecture allows for data distribution and filtering across five levels: endpoint, collection, decoding, SIEM rule, and visualization.

Technical Documentation for SIEM in Pandora FMS

Advanced Event Analysis Reports

Three types of reports have been added to the SIEM module:

  • Event List: Detailed view of each event.
  • Historical Chart: Time-based representation of events grouped by agent, severity, or level.
  • Statistics: Numeric summary by severity.

These reports help identify patterns and prioritize actions in environments with large data volumes.
Plugins and Add-ons for Pandora FMS

Dynamic Filters in the Event Viewer

Dynamic filters have been added to the event viewer to enable advanced searches by event type, agent, or log message, simplifying incident management.

Log Parsing from the Command Line

The parse_siem_log command allows you to evaluate log lines directly from Pandora FMS CLI and preview the events generated. This tool is essential for validating decoders and rules before deployment, optimizing detection and reducin false positives. Log parsing also simplifies integration into orchestration and automated response (SOAR) processes.

Usage example:

Extended Support and Performance Optimization

The SIEM supports logs in CEF (Common Event Format), allowing the integration of data from third-party systems and devices without additional adjustments. This compatibility simplifies the centralization of security logs in heterogeneous environments. Additionally, the rule engine has been optimized to improve efficiency in event evaluation, reducing processing time and ensuring smoother performance in systems handling large data volumes.

SIEM Use Cases in Pandora FMS

The Pandora FMS SIEM enables centralized data collection and analysis from multiple sources: network devices, servers, endpoints, security systems, and applications. It detects abnormal behavior patterns, generates automatic alerts for threats, and allows for real-time quick response. It simplifies incident investigation through detailed history logs and helps meet security regulations and compliance policies. Log parsing through CLI helps validate decoders and rules before deployment, improving threat detection efficiency. These capabilities strengthen protection in distributed environments, simplify security management, and optimize incident response.
The SIEM is a key component within Pandora FMS’s security architecture, which integrates advanced monitoring, log analysis, event correlation, and response tools. This combination allows organizations to adapt their environments to today’s cybersecurity challenges.

About Version 2 Limited
Version 2 Digital is one of the most dynamic IT companies in Asia. The company distributes a wide range of IT products across various areas including cyber security, cloud, data protection, end points, infrastructures, system monitoring, storage, networking, business productivity and communication products.

Through an extensive network of channels, point of sales, resellers, and partnership companies, Version 2 offers quality products and services which are highly acclaimed in the market. Its customers cover a wide spectrum which include Global 1000 enterprises, regional listed companies, different vertical industries, public utilities, Government, a vast number of successful SMEs, and consumers in various Asian cities.

About PandoraFMS
Pandora FMS is a flexible monitoring system, capable of monitoring devices, infrastructures, applications, services and business processes.
Of course, one of the things that Pandora FMS can control is the hard disks of your computers.

Change Management in Pandora ITSM with Full Traceability and Custom Workflows

With version 106 of Pandora ITSM, a critical feature has been introduced for technology environments operating under security frameworks, regulatory compliance, and efficient management: Change Management. This new module allows changes to be registered, approved, implemented, and closed in a structured way, with full traceability and responsibility control.


New ITSM Feature: Integrated Change Management

Controlling changes in IT is no longer optional. It’s a requirement for minimizing operational risks, avoiding human errors, and complying with standards such as ISO 27001, ENS, or SOC2. Many serious incidents originate from poorly managed changes: urgent interventions without documentation, informal approvals, or tasks that fall outside the scope of operational oversight.
The new Change Management feature in Pandora ITSM structures this entire process. From a single interface, you can define the change, document it, assign it, monitor it, and close it, ensuring that every action is properly recorded. The system is designed to adapt to different types of changes (routine, planned, or critical) and fit the realities of each team: roles, permissions, automations, and specialized teams.

Its complete integration with tasks, tickets, inventory, and projects makes it a natural part of the ITSM ecosystem, rather than a standalone component.

What Can You Do Now with Pandora ITSM?

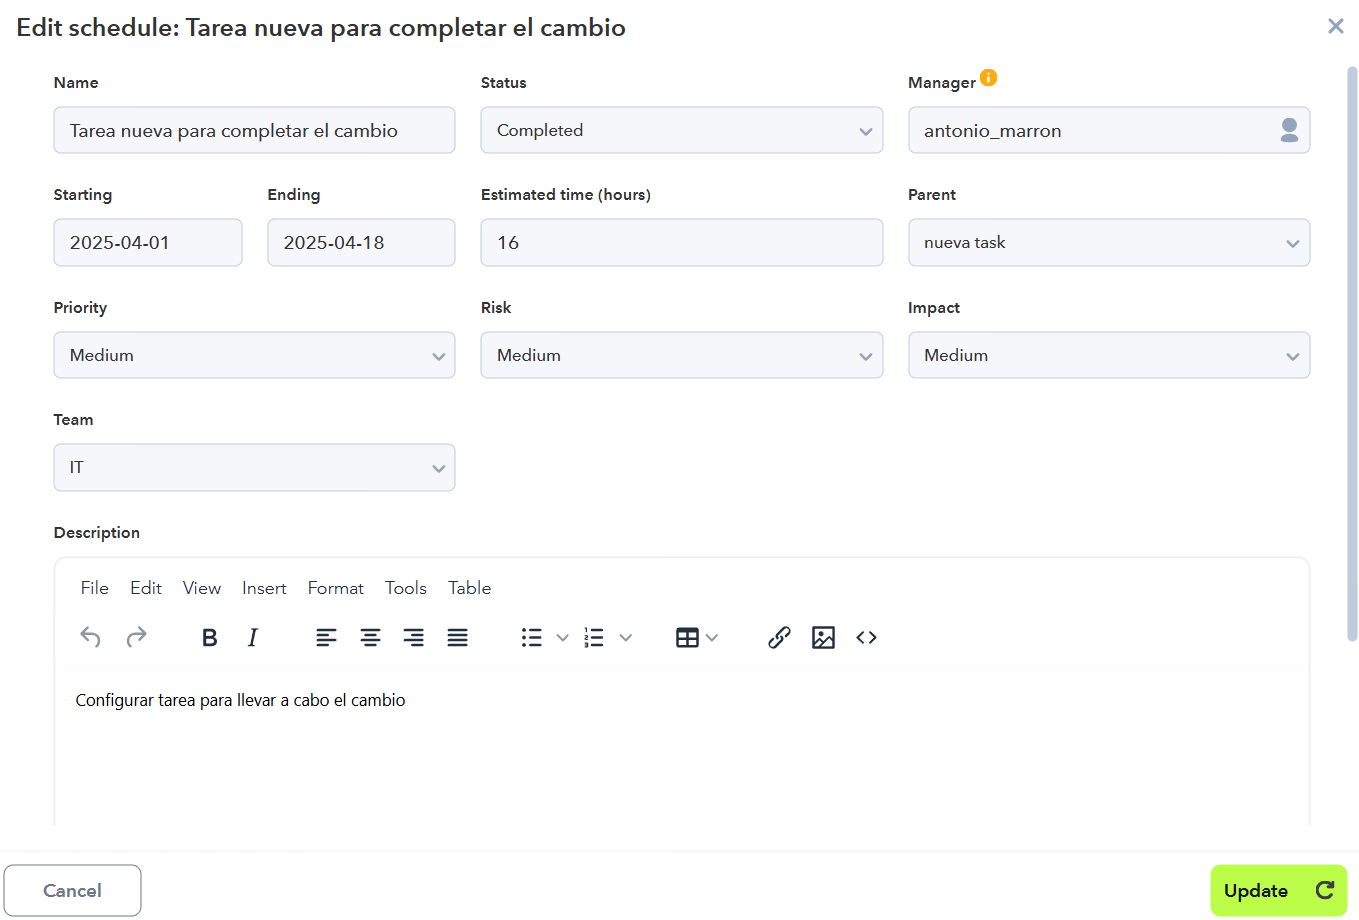
Change Management is not just a record—it’s a complete work cycle with its own statuses, validations, and rules. In Pandora ITSM, the cycle starts with the creation of a request where you can define key fields such as priority, risk, impact, manager, and responsible team.
From there, the change can include:

  • Linked inventory items directly associated with the change.
  • Attached files containing technical documentation or approvals.
  • Non-billable internal notes, useful for coordination without affecting SLAs.
  • Association with specific tickets and tasks, with granular control over time and effort tracking.

Each change follows a defined state flow (New, Authorized, Scheduled, Implement, Review, Closed), with automatic transitions based on task execution. Managers can review the progress at any time, view actual time spent, and audit every step from the Tracker section.

Additionally, you can create reusable change templates, automate notifications based on events, and define change teams with role-based access controls. This allows you to manage everything from low-impact technical changes to critical interventions that require coordination across multiple departments.


Supported Change Types

The system supports three change types, aligned with IT change management best practices:

  • Standard Change: Routine, low-risk changes that can be pre-approved and executed without additional review—for example, a scheduled system reboot.
  • Normal Change: Changes that require formal assessment before execution, involving planning, approval, and final validation.
  • Emergency Change: Critical changes that must be executed immediately due to operational or security reasons, but are still documented and traceable.

The change type defines the initial flow of the process. For example, a standard change moves directly to the Authorized state if created from a template, skipping unnecessary steps while maintaining full traceability.

Automate and Control the Entire Workflow

One of Pandora ITSM’s key strengths is its ability to automate change management without sacrificing control. Some of the core features include:

  • Change templates that pre-configure fields like priority, risk, or impact based on the type of intervention.
  • Custom states for tasks and changes, with built-in logic and validations.
  • Automatic notifications that alert teams when there are pending tasks or required actions.
  • Change teams with hierarchical structure, group email notifications, and advanced access control through ACLs.
  • Workunits to record exact time spent, link it to tasks, and consolidate it into reports.

This entire ecosystem is managed from the Changes Administration sections, where you can define types, states, priorities, risks, templates, and notifications.

What Makes It Different?

Unlike other tools that treat change as a standalone component, Pandora ITSM fully integrates change management with all key operational processes:

  • Linked to inventory, allowing full visibility into affected assets.
  • Connected to projects, enabling change tasks to be part of larger initiatives.
  • Integrated with tickets, so incidents can generate changes, and changes can be tracked through actual execution.
  • Leveraging ITSM’s permission structure, ensuring that no user acts outside of their defined role.

This transforms change management into a true governance and efficiency tool, far beyond basic compliance. The complete log of actions, decisions, tasks, and time spent allows teams to pass audits, evaluate performance, and continuously improve control over the technical environment.

Closure

With this new feature, Pandora ITSM brings change management from theory into real operational practice. It’s no longer about filling out a form or logging a task in a shared Excel file. Every change is controlled from start to finish, with roles, validations, documentation, and monitoring—all fully integrated into your organization’s actual workflows.
In environments where compliance, traceability, and service stability are critical, having a solution that automates, logs, and controls changes is not a competitive advantage—it’s an operational necessity.
Available starting with version 106.
You can find more details in the official Pandora ITSM documentation or log into the console and explore the Changes menu.

Pandora-favicon-2025

Pandora FMS’s editorial team is made up of a group of writers and IT professionals with one thing in common: their passion for computer system monitoring. Pandora FMS’s editorial team is made up of a group of writers and IT professionals with one thing in common: their passion for computer system monitoring.


About Version 2 Limited
Version 2 Digital is one of the most dynamic IT companies in Asia. The company distributes a wide range of IT products across various areas including cyber security, cloud, data protection, end points, infrastructures, system monitoring, storage, networking, business productivity and communication products.

Through an extensive network of channels, point of sales, resellers, and partnership companies, Version 2 offers quality products and services which are highly acclaimed in the market. Its customers cover a wide spectrum which include Global 1000 enterprises, regional listed companies, different vertical industries, public utilities, Government, a vast number of successful SMEs, and consumers in various Asian cities.

About PandoraFMS
Pandora FMS is a flexible monitoring system, capable of monitoring devices, infrastructures, applications, services and business processes.
Of course, one of the things that Pandora FMS can control is the hard disks of your computers.

Enhance Security with SAML: Pandora FMS Now Supports Azure Entra ID

In modern enterprise environments, access management is key to ensuring security and regulatory compliance (ENS, ISO 27001, NIS2, etc.). That’s why Pandora FMS has added support for Azure Entra ID, enabling authentication through SAML (Security Assertion Markup Language). With this integration, we provide simplified and secure access to our platform using Single Sign-On (SSO).

What is SAML and Why Is It Important?

SAML is an open XML-based standard that enables the exchange of authentication and authorization data between an Identity Provider (IdP) and a Service Provider (SP). This means users can authenticate once and gain access to multiple applications without needing to log in repeatedly.
Implementing SSO with SAML in Pandora FMS provides several key benefits:

  • Enhanced security: Reduces reliance on weak or reused passwords, lowering the risk of compromised credentials.
  • Improved user experience: Enables seamless access across different platforms, simplifying the login process for employees, partners, and customers.
  • Regulatory compliance: Supports the adoption of Zero Trust policies and centralized access management.

Integration with Azure Entra ID

Compatibility with Azure Entra ID allows Pandora FMS to integrate with Microsoft’s identity solution, providing centralized control over user authentication. This enables:

  • Centralized authentication for all users in enterprise environments.
  • Automated access management based on roles and permissions defined in Entra ID.
  • Reduced security risks through multi-factor authentication and advanced access policies.

Implementing this functionality allows organizations to align their infrastructure with modern security principles, reduce the attack surface, and ensure controlled access to critical systems.

Configuration in Pandora FMS

To configure SAML with Azure Entra ID in Pandora FMS, communication between both platforms must be established by defining the identity provider and the service provider. This involves creating and configuring an application in Entra ID, assigning the appropriate permissions, and integrating it with the SAML settings in Pandora FMS.
The detailed configuration procedure, including specific steps and advanced options, is available in the Pandora FMS technical documentation, where each required parameter for implementation is thoroughly explained.
With this new feature, we strengthen identity management security and efficiency within Pandora FMS. Compatibility with Azure Entra ID is another step in our commitment to enterprise security, helping organizations optimize authentication and improve access control.

The integration of Pandora FMS with Azure Entra ID not only enhances security but also complements the monitoring capabilities for Microsoft Azure infrastructures. Credential and access management, combined with advanced monitoring, allows businesses to optimize operations and effectively reduce risk.


About Version 2 Limited
Version 2 Digital is one of the most dynamic IT companies in Asia. The company distributes a wide range of IT products across various areas including cyber security, cloud, data protection, end points, infrastructures, system monitoring, storage, networking, business productivity and communication products.

Through an extensive network of channels, point of sales, resellers, and partnership companies, Version 2 offers quality products and services which are highly acclaimed in the market. Its customers cover a wide spectrum which include Global 1000 enterprises, regional listed companies, different vertical industries, public utilities, Government, a vast number of successful SMEs, and consumers in various Asian cities.

About PandoraFMS
Pandora FMS is a flexible monitoring system, capable of monitoring devices, infrastructures, applications, services and business processes.
Of course, one of the things that Pandora FMS can control is the hard disks of your computers.

New Discovery with NetScan for Automated Asset Management in Pandora FMS NG 781 RRR

About Version 2 Limited
Version 2 Digital is one of the most dynamic IT companies in Asia. The company distributes a wide range of IT products across various areas including cyber security, cloud, data protection, end points, infrastructures, system monitoring, storage, networking, business productivity and communication products.

Through an extensive network of channels, point of sales, resellers, and partnership companies, Version 2 offers quality products and services which are highly acclaimed in the market. Its customers cover a wide spectrum which include Global 1000 enterprises, regional listed companies, different vertical industries, public utilities, Government, a vast number of successful SMEs, and consumers in various Asian cities.

About PandoraFMS
Pandora FMS is a flexible monitoring system, capable of monitoring devices, infrastructures, applications, services and business processes.
Of course, one of the things that Pandora FMS can control is the hard disks of your computers.

Monitoring in Hyperconverged Infrastructures: Challenges and Solutions

About Version 2 Limited
Version 2 Digital is one of the most dynamic IT companies in Asia. The company distributes a wide range of IT products across various areas including cyber security, cloud, data protection, end points, infrastructures, system monitoring, storage, networking, business productivity and communication products.

Through an extensive network of channels, point of sales, resellers, and partnership companies, Version 2 offers quality products and services which are highly acclaimed in the market. Its customers cover a wide spectrum which include Global 1000 enterprises, regional listed companies, different vertical industries, public utilities, Government, a vast number of successful SMEs, and consumers in various Asian cities.

About PandoraFMS
Pandora FMS is a flexible monitoring system, capable of monitoring devices, infrastructures, applications, services and business processes.
Of course, one of the things that Pandora FMS can control is the hard disks of your computers.

What Is Snort, How It Works, and Its Integration with SIEM for Cybersecurity

About Version 2 Limited
Version 2 Digital is one of the most dynamic IT companies in Asia. The company distributes a wide range of IT products across various areas including cyber security, cloud, data protection, end points, infrastructures, system monitoring, storage, networking, business productivity and communication products.

Through an extensive network of channels, point of sales, resellers, and partnership companies, Version 2 offers quality products and services which are highly acclaimed in the market. Its customers cover a wide spectrum which include Global 1000 enterprises, regional listed companies, different vertical industries, public utilities, Government, a vast number of successful SMEs, and consumers in various Asian cities.

About PandoraFMS
Pandora FMS is a flexible monitoring system, capable of monitoring devices, infrastructures, applications, services and business processes.
Of course, one of the things that Pandora FMS can control is the hard disks of your computers.

Pandora FMS Stands Out in G2 Spring 2025 Reports: 35 Key Recognitions in Monitoring and Cybersecurity

About Version 2 Limited
Version 2 Digital is one of the most dynamic IT companies in Asia. The company distributes a wide range of IT products across various areas including cyber security, cloud, data protection, end points, infrastructures, system monitoring, storage, networking, business productivity and communication products.

Through an extensive network of channels, point of sales, resellers, and partnership companies, Version 2 offers quality products and services which are highly acclaimed in the market. Its customers cover a wide spectrum which include Global 1000 enterprises, regional listed companies, different vertical industries, public utilities, Government, a vast number of successful SMEs, and consumers in various Asian cities.

About PandoraFMS
Pandora FMS is a flexible monitoring system, capable of monitoring devices, infrastructures, applications, services and business processes.
Of course, one of the things that Pandora FMS can control is the hard disks of your computers.